Assessing food sustainable intensification potential of agroforestry using a carbon balance method
iForest - Biogeosciences and Forestry, Volume 12, Issue 1, Pages 85-91 (2019)
doi: https://doi.org/10.3832/ifor2578-011
Published: Jan 24, 2019 - Copyright © 2019 SISEF
Research Articles
Collection/Special Issue: INCOTW - Sassari, Italy (2017)
International Congress on Cork Oak Trees and Woodlands
Guest Editors: Piermaria Corona, Sandro Dettori
Abstract
Food security, climate change mitigation, and land use challenges are interlinked and need to be considered simultaneously. One possible solution is sustainable intensification, which is the practice of increasing food production per area of land whilst also reducing the environmental impacts associated with this. Agroforestry has been stated to be a practice that meets this definition. In this study, a new methodology is presented to assess the potential of different management options as sustainable intensification practices. The methodology is based on comparing the carbon emissions associated with the production of food and the carbon sequestered for that same activity for a particular quantity of food produced over a specific area and over a specific time. The resulting indicator, the “carbon balance” is the difference between the greenhouse gasses emitted (considered as negative values) and carbon sequestered (positive values) estimated in Mg CO2eq per Mg of food produced on one hectare of land for one year. The carbon balance quantifies the global warming potential associated with sustainable intensification by integrating a process-based model with life cycle analysis and is able to estimate above- and below-ground biomass and soil carbon content. This methodology is tested in Portugal for wheat production under crop monoculture and agroforestry systems. The results show agroforestry to be a suitable practice for sustainable intensification compared to a crop monoculture as it just slightly decreased wheat yields whilst providing a positive carbon balance from year 50 onwards of approximately 1 Mg of CO2eq sequestered per Mg of wheat produced.
Keywords
Climate Change Mitigation, Food Security, Land-use Occupation, Regulating Ecosystem Services, Soil Fertility, Life Cycle Analysis, Yield-SAFE, Clipick, Carbon Sequestration
Introduction
The land required for food production occupies 38% of the total land area of the world and agriculture is responsible for 19% to 29% of total global anthropogenic greenhouse gas (GHG) emissions ([11], [45]). The GHG associated with agriculture is also steadily increasing due to the need to feed a growing global population ([42]). In 2009 the Food and Agriculture Organization of the United Nations ([10]) stated that the challenges associated with the reduction of GHG emissions, food security, and land use should be dealt with simultaneously on the same land parcel. Since then, even though the concept is unclear even for experts ([34]), sustainable intensification (SI) has been identified as a strategy for improving food security while maintaining biodiversity and ecosystems services ([14], [15]).
Agroforestry is one of the most common land use practice worldwide ([9]). It consists of integrating woody vegetation with crop and/or animal production and it has been often referred to as an example of a SI practice that is able to satisfy food security concerns while producing other benefits ([13], [14]). It can provide higher yields of provisioning ecosystem services (food, materials, and energy) in comparison with obtaining the same provisioning ecosystem services from monoculture systems ([17], [43], [6]). At the same time agroforestry can reduce soil erosion, nitrate leaching ([26]), greenhouse gas emissions and potentially achieve net carbon sequestration per unit of product ([14], [45]). In Portugal, agroforestry systems are extensively found in the form of the montado, which combines low density (less than 80 trees per hectare) spatially dispersed cork oak trees (Quercus suber) and holm oak trees (Quercus ilex subsp. rotundifolia) with pasture on which livestock graze freely. The montado occupies around 0.75 million ha in Portugal and its equivalent system in Spain (dehesas) around 1.5 million ha. The most important product provided by the montado is cork, and Portugal is the world’s largest cork producer with 49.6% of world cork production. The system provides other provisioning ecosystem services such as wood, charcoal, crops, fodder, meat, dairy products, honey, mushrooms, and medicinal and aromatic plants ([33], [36], [23]). In the 1930s, in order to increase internal food production, cereal cultivation under the trees was promoted, and a silvoarable version of the montado developed. However, this intensification process (including mechanisation and fertilisation) occurred without considering the fragility and low quality of the soils. As a consequence, tree density was reduced, the roots of the remaining trees were affected and the soil erosion increased. All together lead to a general impoverishment of the soils and a further decrease in crop yields which in the following years caused the final abandonment of the fields ([35]).
Physiological growth models are models that simulate ecological processes in order to estimate vegetative growth. These models are useful in decision-making that relates to the management of natural resources in the context of climate change ([8]). The agroforestry model Yield-SAFE is a process-based model that simulates competition between trees and crops for water and light. It has been widely used in Europe including for silvoarable systems of poplar and cereals in the UK, Netherlands, Spain, and France ([17]); cherry tree pastures in Switzerland ([40]) and the Portuguese montado ([27]). Recently, during the AGFORWARD project ([3]) the model was further developed and calibrated for more tree and crop species ([28], [31]).
In this study we have developed a so called “carbon balance method” which quantifies GHG emissions using Life Cycle Assessment (LCA) for estimating the Global Warming Potential (GWP) of crop and tree production as well as the positive effects of carbon sequestration. Applied to crop production, this approach could be useful for estimating the SI potential of different land management practices. The method follows FAO which advocates reducing GHG emissions advice (for climate change mitigation), increasing food production (for food security), and reducing land occupation (for reduced land use change) simultaneously by comparing the level of greenhouse gas emitted by the practice (using the GWP impact from a LCA approach) with the carbon sequestered by the system (using a process-based growth model) for the same yield of product (Mg of food) per area of land (hectare). The carbon balance of the product (in CO2eq per Mg of food) provides a means of comparing the impact of food production under different management practices. The methodology is tested by comparing the carbon balance for growing 1 Mg of wheat in central Portugal using two alternative management scenarios: (i) a wheat crop monoculture; and (ii) a montado agroforestry system combining wheat cultivation with low density cork oak trees (Quercus suber L.).
Materials and methods
Definition of management scenario options
For this study, two different management options for wheat cultivation were compared: (i) wheat monoculture crop system; and (ii) montado agroforestry system combining wheat production with cork oak. Growth of both land use alternatives were simulated using the improved version of the Yield-SAFE model ([28], [31]). Both management options were simulated for Montemor-o-Novo (Portugal - longitude: 38.72°; latitude: -8.32°). In this region, the most common wheat specie produced is Triticum aestivum L. Average yields from 1990 to 2011 in Portugal were around 1.4 Mg ha-1 year-1 ([2]). In Portugal, wheat is sown in the autumn (November) when temperatures begin to fall. Vegetative growth takes place in winter and it is harvested in early summer in the first weeks of June, before the hottest months of the year ([39]). For this study, the rotation simulated was a typical wheat-wheat-fallow rotation.
Whilst the crop monoculture land use was assumed to be planted on 100% of each hectare, the agroforestry management option assumed a crop area that covered 90% with 10% of each hectare being covered by trees. These were assumed to be planted at an initial density of 200 trees ha-1, and then thinned every 10 years to reach a final density of 35 trees ha-1 at year 70.
Global warming potential
The carbon balance method for this study used the conversion factors published by the IPCC (Intergovernmental Panel on Climate Change - [20]) and considered the GWP of different gaseous emissions through a common metric (CO2eq) which in this study expresses the potential contribution of gaseous emissions to global warming over a time horizon of 100 years (GWP 100).
Sources of gaseous emissions were associated with the management practices for wheat and cork oak ([22], [16]) including the operations for the establishment of the stand, maintenance and growth, harvesting, and the transport of system products and workforce. In agroforestry, the emissions from the cork oak stand management and wheat were considered proportionally to the area occupied by the tree and the crop components for field operations (10% and 90%, respectively) but the same distance was used for the transport of system products and the workforce (5 km).
The three main GHG gases included in the study were carbon dioxide (CO2), methane (CH4) and nitrous oxide (N2O). These were assessed for four main sources including: (i) the combustion of fuels used in the field operations; (ii) the emissions related to the production and application of fertilisers and seeds; (iii) the transport of the products from field to farm; and (iv) soil microbial activity.
For the wheat systems, field operations included ploughing with disk harrows at the beginning of November and harrowing at the same time as sowing two weeks later. For sowing, a fine grain seeder was used at a seeding rate of 180 kg ha-1 and Diammonium phosphate (18:46:0) applied at a rate of 250 kg ha-1. In March, fertiliser was applied again using 170 kg ha-1 of urea-based fertiliser (46% N). Weeding was accomplished by using a single application of 0.4 kg ha-1 of herbicide 2.4-D. A combined harvester was used for harvesting the wheat (Tab. 1).
Tab. 1 - Source of greenhouse gas emissions from wheat production. (a): Rosado ([39]); (b): Kramer et al. ([22]); (c): Abrahão et al. ([1]); (d): Mäkelä ([24]); (e): IDAE ([19]); (g): IPCC ([20]); (h): based on the conversion factor for N fertiliser to N2O emissions of 2.55% ([37]).
| Input production | Quantity | GWP 100 (kg CO2eq kg-1) |
GHG (kg CO2eq) |
|---|---|---|---|
| Seeds (kg ha-1) | 180 a | 0.241 b | 43.4 |
| Fertiliser (kg N ha-1) | 45 | 2.66 b | 119.7 |
| Urea (kg ha-1 - 46% N) | 170 a | 0.730 c | 124.1 |
| Pesticide (kg ha-1) | 0.4 c | 3.92 b | 1.57 |
| Sub total | - | - | 288.77 |
| Field operations | Consumption (l ha-1) |
GWP 100 (kg CO2eq l-1) |
GHG emissions (kg CO2eq) |
| Plough with disc harrows | 7 e | 2.6 d | 18.2 |
| Sowing+Fertilization | 8 e | 2.6 d | 20.8 |
| Weeding with hydraulic sprayers | 4 e | 2.6 d | 10.4 |
| Harvesting+Baling | 12 e | 2.6 d | 31.2 |
| Transport of workers (5km) | 1.5 e | 2.6 d | 3.9 |
| Transport of product (5 km, go empty) | 2 e | 2.6 d | 5.2 |
| Transport of product (5 km, return full) | 2.5 e | 2.6 d | 6.5 |
| Sub total | - | - | 96.2 |
| Emission from fertilisers | N2O emissions (kg N2O ) |
GWP 100 (kg CO2eq N2O-1) |
GHG emissions (kg CO2eq) |
| Emission from N fertiliser (45+78.2 Kg N) | 3.1 h | 298 g | 923.8 |
| Sub total | - | - | 923.8 |
| Total | - | - | 1321.1 |
In the cork oak agroforestry systems, the time required for field operations and the rate of fuel consumption for field operations was established using national data ([4]). Field operations included soil preparation to clear vegetation, and the ripping and ploughing of all the area. It was assumed that the ploughing for the wheat and for the trees would be done at the same time. The trees were assumed to require fertilization at the rate of 125 g of NPK (7:21:21) per plant ([16]). During the first year, 20% of the trees were assumed to require replacement due to mortality without additional fertilizer being applied. Pruning was assumed to be required every eight years and cork debarking every nine years, but this was done manually and therefore not considered to be a GHG emission source. Usually in a cork oak plantation, vegetation clearing is undertaken every four to five years, but as wheat is cultivated in the area between the trees, this operation was not included here. A petrol chainsaw was considered for pruning and thinning operations (Tab. 2).
Tab. 2 - Source of greenhouse gas emissions for cork oak agroforestry management. (a): Gonzalez-Garcia et al. ([16]); (b): Kramer et al. ([22]); (c): IDAE ([19]); (d): Mäkelä ([24]); (e): CAOF ([4]); (g): IPCC ([20]); (h): based on the conversion factor for N fertiliser to N2O emissions of 2.55% ([37]); (*): the values for pruning and thinning operation are presented per tree as the total value depend on the tree density.
| Input production | Quantity | GWP 100 (kg CO2eq kg-1) |
GHG (kg CO2eq) |
|---|---|---|---|
| Plants (trees ha-1) | 200 | - | - |
| Fertiliser (kg N ha-1) | 1.75 | 2.66 b | 4.6 |
| Sub total | - | - | 4.6 |
| Field operations | Consumption (l ha-1) |
GWP 100 (kg CO2eq l-1) |
GHG emissions (kg CO2eq) |
| Clearing | 6.8 c | 2.6d | 17.7 |
| Ripping | 20.0 c | 2.6d | 52.0 |
| Plough with disc harrows | 9.8 c | 2.6d | 25.48 |
| Planting+Fertilization | Manual | - | - |
| Replanting | Manual | - | - |
| Transport of workers (5 km) | 1.5 c | 2.6d | 3.9 |
| Sub Total | - | - | 99.08 |
| Tree operations | Consumption (l tree-1) |
GWP 100 (kg CO2eq l-1) |
GHG emissions (kg CO2eq) |
| Pruning (depends on tree density) | 0.26 e | 2.3 d | 0.6 * |
| Thinning (depends on tree density) | 0.10 e | 2.3 d | 0.2 * |
| Debarking | Manual | - | - |
| Sub Total | - | - | 0.8 |
| Emission from fertilisers | N2O emissions (kg N2O ) |
GWP 100 (kg CO2eq N2O-1) |
GHG emissions (kg CO2eq) |
| Emissions from N fertiliser (1.75 kg N) | 0.04 h | 298 g | 13.29 |
| Sub Total | - | - | 13.29 |
| Total | - | - | 117.77 |
Kramer et al. ([22]) reported 0.241, 2.66 and 3.96 kg CO2eq kg-1 for the production of wheat seeds, nitrogen fertiliser, and pesticides respectively. GHG emissions derived from the use of nitrogen fertiliser were added to the field operation emissions, since approximately 2.55% of N-fertiliser is converted to N2O ([37]).
Modelling with Yield-SAFE
The Yield-SAFE model is a process-based dynamic model for predicting resource capture, growth, and production in forestry, agroforestry and agricultural systems ([44], [28], [31]). The model can be used to estimate carbon sequestered by the tree and crop biomass and the soil using an application of the RothC model within Yield-SAFE ([30]). The carbon sequestered was estimated assuming that 50% of the biomass was carbon. Biomass in this study included above-ground biomass (AGB) and below-ground biomass (BGB) that is estimated using a root-to-shoot ratio of 0.43 and 0.31 for cork oak and wheat, respectively ([27], [41]), but excluded output products of both systems, including wood from pruning, cork debarked, wheat grain and straw. Tree leaves and roots and wheat roots after harvesting were included as inputs for the soil carbon model. The period of simulation was 80 years and the weather data used for the simulations was extracted from Clipick ([29]) which uses data from the KNMI regional atmospheric climate model RACMO ver. 2.2 previously tested in the country ([32]). Cork oak and wheat parameter sets for Yield-SAFE were taken from Palma et al. ([27], [31]).
Carbon balance estimation
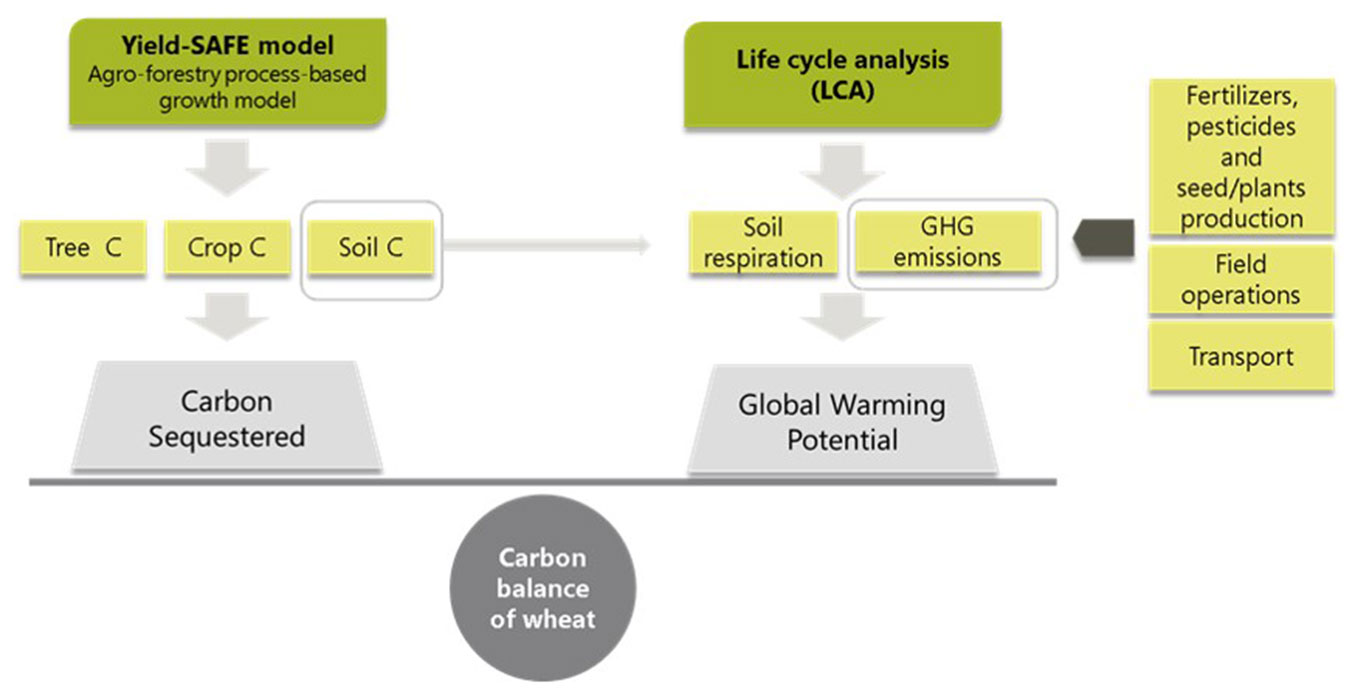
The estimation of the Carbon Balance of the wheat and agroforestry systems was calculated as the difference between: (1) the amount of GHG emissions with GWP (CO2eq) emitted by different activities and products used during the growth process; and (2) the amount of carbon sequestered in the above- and below-ground biomass and in the soil (Fig. 1). The CO2eq emissions released from soil biota were included as GHG emission (soil respiration). Results were expressed in Mg of CO2eq Mg of wheat grain-1.
Fig. 1 - Methodology used to estimate the carbon balance of a functional unit (Mg of CO2eq Mg of wheat grain-1) by comparing the estimation of the Yield-SAFE model of the carbon sequestered by the tree, crop and soil components and the greenhouse gas emissions derived from fertilizers, pesticides and seed/plants production, field operations, transport and soil respiration.
Results
Predicted yields of the Yield-SAFE model
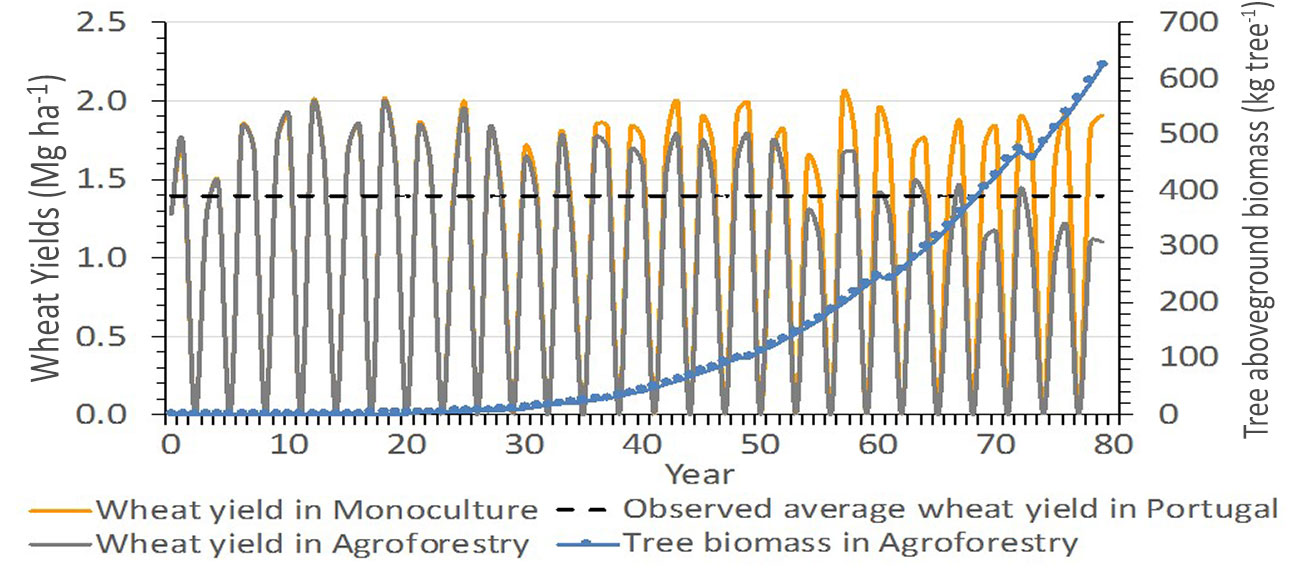
The average wheat yield over 80 years for the wheat monoculture was predicted by Yield-SAFE to be 1.73 Mg ha-1 year -1 (excluding the fallow years - Fig. 2). This yield was slightly higher than the expected wheat yield in the country that is of 1.4 Mg ha-1 year-1 ([2]). The agroforestry wheat on a per hectare crop basis, compared to the monoculture wheat, had similar yields during the first part of the simulation period (from year 1 to year 30), slightly lower yields during the middle part of the simulation period (from year 30 to year 50), and much lower yields during the last part of the simulation period (from year 50 to year 80 - Fig. 2). However, on average, wheat production on the agroforestry system was of 1.53 Mg ha-1 year-1. The accumulated biomass in the tree component was approximately 0.650 Mg tree-1 and this was similar to the above-ground biomass for trees of the same age in similar conditions in Portugal ([27]).
Fig. 2 - Tree growth and wheat yields simulated by the Yield-SAFE model for a wheat monoculture (wheat yield in monoculture) and an agroforestry system (wheat yield in agroforestry and tree biomass in agroforestry) combining wheat and cork oak trees in Portugal, compared to the observed average yield in Portugal for the period 1990-2011 by Almeida & Maças ([2] - observed average wheat yield in Portugal).
Carbon balance
The predicted GWP for wheat of 0.81 Mg CO2eq Mg of wheat-1 was close to that reported by Rosado ([39]) for lower average yields, i.e., 1.08 MgCO2eq Mg of wheat-1. For cork oak, Gonzalez-Garcia et al. ([16]) reported a GWP potential from forest operation of 1.64 Mg CO2eq ha-1 for a cork oak stand of 100 tree ha-1, whilst in this study, the GWP from forest operations (including fertiliser use) were 0.49 Mg CO2eq ha-1, although this was for a final tree density of 35 tree ha-1 and did not include the vegetation clearing operation that occurred every 3-4 years in Gonzalez-Garcia et al. ([16]). In terms of carbon sequestration of the tree component of the system, the above-ground biomass estimated in this study was 1.19 Mg CO2eq in year 80 (0.325 Mg C tree-1). This is similar to Palma et al. ([27]) who used Yield-SAFE and the same carbon sequestration method for a slightly higher final tree density (50 trees ha-1) agroforestry system in Portugal and reported a cork oak tree carbon content of 1.32 Mg CO2eq (0.362 Mg C tree-1) in year 80.
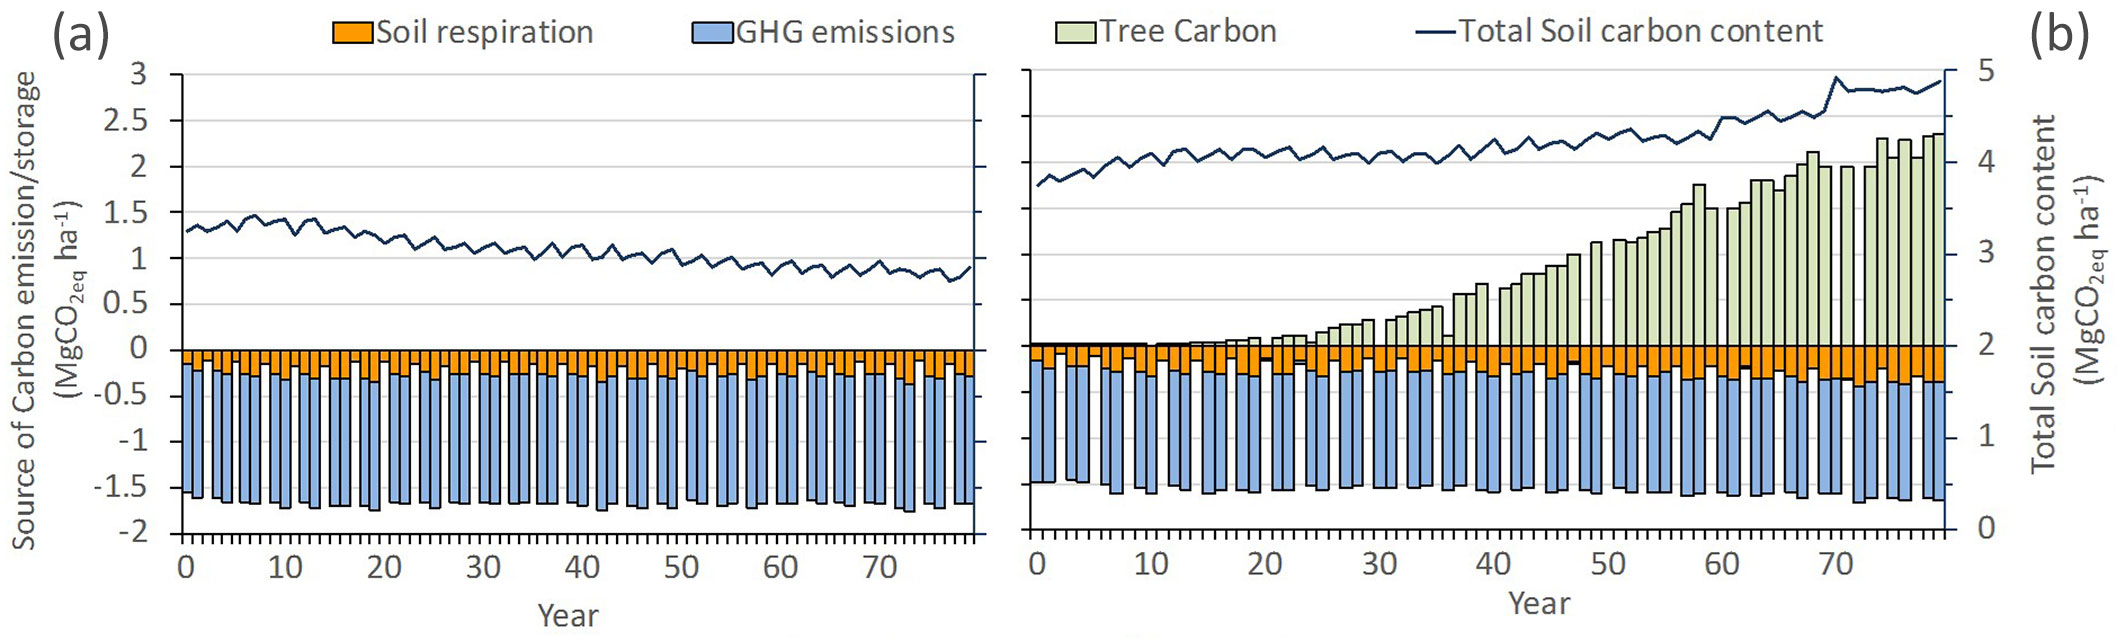
GHG emissions from wheat field operations, and fertiliser, seed and pesticide production were the main contributions to the GWP identified (GHG emissions in Fig. 3). For agroforestry were quantified in the range of 0 and 1.34 Mg CO2eq ha-1 depending on crop and tree field operations (GHG emissions in Fig. 3) and of between 0 and 1.4 Mg CO2eq ha-1 for the monoculture system, depending if wheat was cultivated or not. This source of emission was slightly lower for agroforestry due to the fact that crop area was also lower (10% less). Respiration from the soil biota activity was also a source of GHG emissions (soil respiration in Fig. 3) and was related to the crop yield: the soil can act as a sink or as an emitter of carbon, depending on the quantity of plant material accumulated in the soil during the year. In the wheat monoculture system, even in wheat cultivation years, the input of plant material was not sufficient to offset soil carbon loss by respiration, and soil carbon content decreased by 20% over the simulation period. By contrast, in the agroforestry system, additional input from trees (roots and leaves) allowed the soil to increase the quantity of carbon stored and therefore act as a carbon sink, and this especially from year 35 onwards (Fig. 3). The effects of the gains or losses in terms of carbon in soil are reflected in the total soil carbon content (Fig. 3). The tree component (tree carbon in Fig. 3) of the agroforestry system was the largest carbon sink for most of the simulation period. During the thinning years the amount of carbon stored in the tree component was assumed to be neutral, i.e., there are neither losses nor gains of carbon in the tree component. This is because in thinning years the tree density is reduced and the remaining trees do not compensate the carbon losses derived. As these outgoing trees continue to store the carbon even outside the system, it is considered that during these years there is neither positive nor negative tree growth.
Fig. 3 - Carbon sources of emissions and storage (in MgCO2eq ha-1) for monoculture (a) and agroforestry (b) management systems for wheat production including emissions from soil biota respiration (soil respiration), from field operations and fertiliser, seed and pesticide production (GHG emissions) and carbon sequestered by tree (tree carbon) and stored in soil (total soil carbon content).
Agroforestry for food sustainable intensification
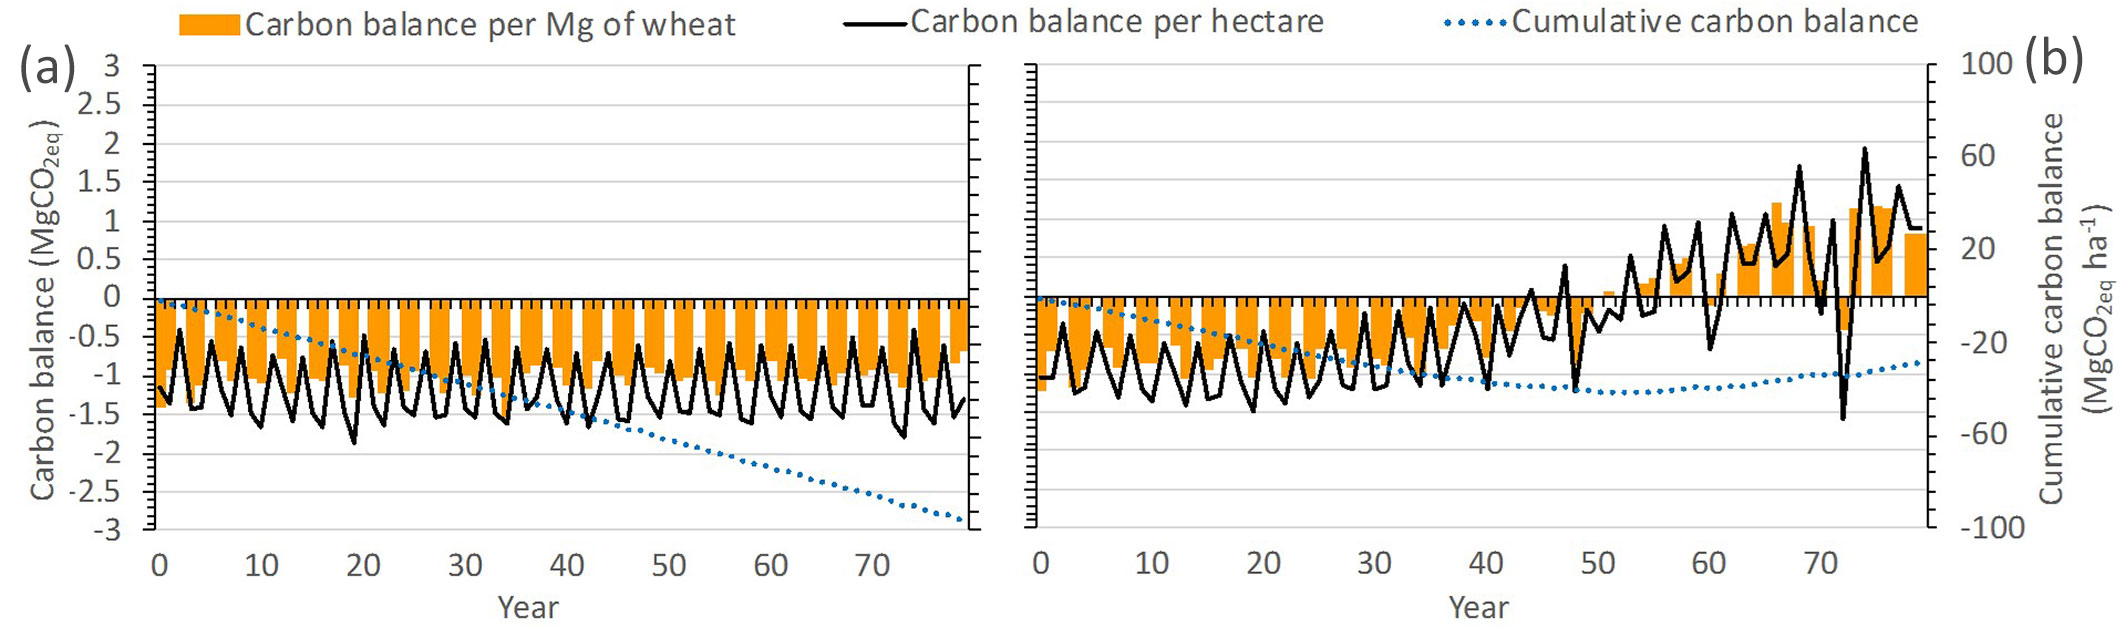
The second step of this study was to assess the balance between the GHG emitted and the carbon sequestered during production of wheat in the agroforestry and monoculture systems. If the same quantity of wheat is produced on the same area of land, with reduced carbon emissions, this can be considered to satisfy the SI process. The average yield in the agroforestry system (1.53 Mg of wheat ha-1 year-1) was found to be slightly lower over the 80 year simulation period than the monoculture yield (1.73 Mg of wheat ha-1 year-1). Results showed that in the monoculture management option, the production of 1 Mg of wheat was associated with a negative carbon balance result of 1 Mg CO2eq (Fig. 4). In agroforestry, the production of 1 Mg of wheat was linked to an initial negative carbon balance of around 1 Mg CO2eq whilst the trees were small. But as the trees grew over time, the carbon balance improved and by year 50 became positive, suggesting that agroforestry, when the trees become mature, could have a positive carbon balance of 1 Mg CO2eq for the production of each Mg of wheat (Fig. 4).
Fig. 4 - Differences between carbon emissions and carbon sequestered per ton of wheat produced (carbon balance per Mg of wheat), per hectare of system occupied by (a) monoculture or (b) agroforestry (carbon balance per hectare) and the cumulative values (cumulative carbon balance) for two management option for wheat production in Portugal (monoculture and agroforestry).
Discussion
The methodology presented here integrates process-based modelling and LCA so that changes in practices that could lead to sustainable intensification can be evaluated. This is done by comparing the GHG emissions and carbon sequestration trade-off of a functional unit, in this study, the production of 1 Mg of wheat. Furthermore, the carbon balance integrates dimensions that can be used to consider the three main challenges for SI referred to by the FAO, which include: (i) food security; (ii) climate change mitigation; and (iii) land occupation. Producing results in terms of a carbon balance per Mg-1 crop ha-1 year-1 helps to provide an approach that can be used to make the SI concept more workable, an aspect of the concept that has been challenging ([34]).
In this study, the results of the carbon balance for wheat under two different land management options has confirmed that the agroforestry option provided an improvement over the monoculture because it: (i) produced similar yields (ensures food security); (ii) helped with climate change mitigation (positive carbon balance after year 50); and (iii) avoided the need to increase the area of land occupied by agriculture as per hectare yields were similar to the monoculture option.
In agroforestry systems the integration of woody vegetation together with wheat allows the system to make a more efficient use of natural resources such as light and water, resulting in higher land equivalent ratios that can be achieved by growing trees and crops separately ([17]). This may be due to complementarity in the use of resources or sometimes because trees may help to retain natural resources such as soil and water, increasing the amount of energy accumulated and the provisioning of ecosystem services ([6]). However these findings are also contested ([7], [38], [43]). Nevertheless, the algorithms recently implemented in Yield-SAFE ([28]) attempt to account for the effect that trees have on buffering minimum and maximum temperatures whilst reducing wind speeds. This leads to reduced water losses due to reduced evapotranspiration, enabling an extension of the growing season, or at least as in this study, maintain yields despite tree competition.
The agroforestry system here was found to reduce GHG emissions directly. In fact, even if the combination of the two activities (forestry and agriculture) increased the number of field operations required, the reduction of area dedicated to crop and the fertiliser used reduced the total GHG emitted for the crop area from 1.4 Mg CO2eq to 1.27 Mg CO2eq ha-1. However, here, after year 50 of the rotation, a positive carbon balance was nevertheless achieved and this was due to the incorporation of the trees that after a certain amount of time were able to numerically offset the GHG emissions associated with both activities whilst maintaining a similar level of crop production.
The increase in the demand for food has been met either by increasing fertiliser, machinery use, or genetic improvement (intensification), or by increasing the area of land occupied by agriculture (extensification). Both strategies have large impacts on GHG emissions and if badly managed can lead to an impoverishment of soils and in a reduction of yields as a consequence, as was the case in the silvoarable montado in Portugal ([35]). Agroforestry is a strategy that can help to increase food production without requiring the conversion of new land. As noted by the FAO, this is an important aspect of intensification.
Furthermore, agroforestry helps provide important environmental benefits like reducing soil erosion ([25]), nitrate leaching ([26], [21]), net greenhouse gas emissions ([14]) and improve biodiversity conservation ([43]), soil enrichment ([18]) and enhance climate change mitigation by sequestering more carbon in soils ([5]). Whilst, not evaluated in this study, these benefits strengthen the case for the promotion and implementation of agroforestry systems in Europe as SI practices.
Compared to crop monocultures of trees and crops, agroforestry systems can help to ensure farm profitability as crop yields and tree growth are similar or even higher ([12]), enhance financial security as production is diversified and stimulate rural economics through new product streams.
In the case of Portugal, this work suggests that implementation of agroforestry systems instead of crop monocultures for wheat production is preferable, because this land use option, when mature (from year 50 onwards), could provide a net carbon sequestration rate of around one Mg of CO2eq for every Mg of wheat produced; and even more when considering that in the existent soil and climate conditions other agricultural uses would be of difficult implementation ([35]). In Portugal in 2011, the area of wheat production was 276.000 ha and the average wheat yield was about 1.4 Mg ha-1 producing a total of 386.400 Mg of wheat per year ([2]). A change of production from crop monoculture to agroforestry could result in substantial carbon sequestration in the near future to offset the GHG emissions associated with wheat production.
The carbon balance method presented here appears to be a useful approach for evaluating SI practices. In this study, the method was applied to wheat production in Portugal as this is a significant crop in the country and globally. However, the carbon balance method could be used for evaluating other provisioning ecosystem services, including other crops, meat, timber, cork, nuts or fruit. The method could also be applied to forestry and orchard systems as the base methodologies used (LCA approach and Yield-SAFE model) are compatible.
Conclusion
This study compares the carbon emissions and carbon sequestration to produce a carbon balance of the product being assessed. Applied to food production the method here enables the SI of different management options to be compared. The results in Mg CO2eq Mg food-1 applied for the same area (1 ha of system) and time (1 year) facilitate this comparison. Positive values represent net carbon sequestration whilst negative values represent net carbon emissions. The SI potential was analyzed for wheat production for two different management options, a crop monoculture and an agroforestry system. The crop monoculture had a negative carbon balance during the entire simulation (80 years) of around 1 Mg CO2eq Mg wheat-1. Under a cork oak agroforestry system, the carbon balance was positive from year 50 onwards and for every Mg of wheat produced 1 Mg of carbon dioxide equivalent was sequestered, confirming that agroforestry could be used as a SI practice.
Acknowledgments
We acknowledge the financial support provided by the Portuguese Foundation for Science and Technology (FCT) through the scholarship SFRH/BD/52691/2014 and PEST (UID/AGR/00239/2013) and the European Community’s Seventh Framework Programme under Grant Agreement No. 613520 (Project AGFORWARD).
References
Gscholar
CrossRef | Gscholar
CrossRef | Gscholar
CrossRef | Gscholar
Online | Gscholar
CrossRef | Gscholar
Online | Gscholar
CrossRef | Gscholar
Authors’ Info
Authors’ Affiliation
Joana A Paulo
Margarida Tomé
João HN Palma
Forest Research Centre, School of Agriculture, University of Lisbon, Tapada da Ajuda s/n, 1349-017 Lisbon (Portugal)
Basque Centre for Climate Change (BC3), 48940, Leioa, Basque Country (Spain)
Corresponding author
Paper Info
Citation
Crous-Duran J, Graves AR, Garcia-de-Jalón S, Paulo JA, Tomé M, Palma JHN (2019). Assessing food sustainable intensification potential of agroforestry using a carbon balance method. iForest 12: 85-91. - doi: 10.3832/ifor2578-011
Academic Editor
Piermaria Corona
Paper history
Received: Aug 01, 2017
Accepted: Nov 10, 2018
First online: Jan 24, 2019
Publication Date: Feb 28, 2019
Publication Time: 2.50 months
Copyright Information
© SISEF - The Italian Society of Silviculture and Forest Ecology 2019
Open Access
This article is distributed under the terms of the Creative Commons Attribution-Non Commercial 4.0 International (https://creativecommons.org/licenses/by-nc/4.0/), which permits unrestricted use, distribution, and reproduction in any medium, provided you give appropriate credit to the original author(s) and the source, provide a link to the Creative Commons license, and indicate if changes were made.

Web Metrics
Breakdown by View Type
Article Usage
Total Article Views: 36231
(from publication date up to now)
Breakdown by View Type
HTML Page Views: 30138
Abstract Page Views: 2655
PDF Downloads: 2891
Citation/Reference Downloads: 4
XML Downloads: 543
Web Metrics
Days since publication: 1913
Overall contacts: 36231
Avg. contacts per week: 132.58
Article Citations
Article citations are based on data periodically collected from the Clarivate Web of Science web site
(last update: Feb 2023)
Total number of cites (since 2019): 4
Average cites per year: 0.80
Publication Metrics
by Dimensions ©
Articles citing this article
List of the papers citing this article based on CrossRef Cited-by.
Related Contents
iForest Similar Articles
Research Articles
Future land use and food security scenarios for the Guyuan district of remote western China
vol. 7, pp. 372-384 (online: 19 May 2014)
Editorials
Change is in the air: future challenges for applied forest research
vol. 2, pp. 56-58 (online: 18 March 2009)
Research Articles
Voluntary carbon credits from improved forest management: policy guidelines and case study
vol. 11, pp. 1-10 (online: 09 January 2018)
Research Articles
Soil C:N stoichiometry controls carbon sink partitioning between above-ground tree biomass and soil organic matter in high fertility forests
vol. 8, pp. 195-206 (online: 26 August 2014)
Research Articles
An assessment of climate change impacts on the tropical forests of Central America using the Holdridge Life Zone (HLZ) land classification system
vol. 6, pp. 183-189 (online: 08 May 2013)
Research Articles
Could cattle ranching and soybean cultivation be sustainable? A systematic review and a meta-analysis for the Amazon
vol. 14, pp. 285-298 (online: 08 June 2021)
Research Articles
Effects of tree species, stand age and land-use change on soil carbon and nitrogen stock rates in northwestern Turkey
vol. 9, pp. 165-170 (online: 18 June 2015)
Technical Reports
The treatment of land use, land use change and forestry in the post-2012 climate agreement: a perspective from non-Annex I Parties
vol. 3, pp. 56-58 (online: 17 May 2010)
Research Articles
Estimating changes in soil organic carbon storage due to land use changes using a modified calculation method
vol. 8, pp. 45-52 (online: 17 June 2014)
Review Papers
Carbon neutrality of forest biomass for bioenergy: a scoping review
vol. 16, pp. 70-77 (online: 05 March 2023)
iForest Database Search
Google Scholar Search
Citing Articles
Search By Author
Search By Keywords