Hemlock woolly adelgid niche models from the invasive eastern North American range with projections to native ranges and future climates
iForest - Biogeosciences and Forestry, Volume 12, Issue 2, Pages 149-159 (2019)
doi: https://doi.org/10.3832/ifor2883-012
Published: Mar 04, 2019 - Copyright © 2019 SISEF
Research Articles
Abstract
The hemlock woolly adelgid (Adelges tsugae Annand - HWA) is invasive in eastern North America where it causes extensive mortality to hemlock communities. The future of these communities under projected climate change is an issue of landscape ecological interest and speculation. We employed the MaxEnt algorithm with the random subset feature selection algorithm (RSFSA) in creating HWA niche models. Final models were ensembles of 12 statistically best models with six predictors each. Out of 119 climatic, topographic, and soil variables, 42 were used in at least one final model. Soil features, followed by climate and topographic features, were most common in selected models. The three most important variables among all models were November potential evapotranspiration, slope, and percent Ochrepts soil. The potential distributions of HWA within eastern North America were projected under historical and four future climate scenarios for 2050 and 2070 under low and high CO2 emissions. The mean of the minimum values for the minimum temperature of the coldest month from the 12 MaxEnt model projections in eastern North America was -15.8°C. This value was close to -15°C, the extreme minimum temperature found for both HWA occurrence points and previously reported HWA cold temperature limits. These results indicate that HWA may be close to equilibrium distribution in eastern North America under current climate. We also reverse-casted the eastern North American MaxEnt model back onto the HWA native ranges in eastern Asia and western North America. The projections match best with native ranges in Asian islands, such as Japan, and the Cascade Mountains in western North America. Statistically significant HWA range shifts of 221-468 km northwards and 110-164 km eastwards were projected by the 12 models for 2050-2070. The 2070 high CO2 emission scenario models projects HWA suitability throughout most of the northern range of eastern hemlock.
Keywords
Ecological Niche Modeling, Climate Change, Hemlock Woolly Adelgid, Invasive Species, MaxEnt, Feature Selection
Introduction
The hemlock woolly adelgid (HWA - Adelges tsugae Annand, Hemiptera: Adelgidae) is a non-native invasive insect in eastern North America causing high mortality to native hemlock species ([50]). The HWA was recorded for the first time in Richmond of Virginia, in 1951; however, it was most likely introduced much earlier ([33]). The genotype of HWA in the eastern USA originates from low elevations in southern Japan, on southern Japanese hemlock (Tsuga sieboldii Carriére - [18], [20]). The current aggressive expansion in eastern USA on eastern hemlock (Tsuga canadensis [L.] Carrière) started in the 1980s and was possibly related to climatic factors ([50]).
All ten hemlock species (Tsuga spp.) in Asia and North America serve as host species of HWA. However, HWA is a serious pest only on the two native hemlock species of eastern North America, eastern hemlock and Carolina hemlock (Tsuga caroliniana Engelman. - [18]). These hemlocks are observed to have little to no resistance against HWA infestations ([35]). Another reason for the successful HWA establishment in the eastern US is the lack of natural enemies ([35]). Hemlock mortality typically occurs in four to 10 years ([50], [36]), but stand level mortality may occur as soon as in two to three years ([55]). Impacts of hemlock decline by HWA include alterations in ecosystem functions and services, as well as negative effects to other plant species and wildlife ([47], [15]). Hemlock decline affect both terrestrial and stream ecosystems.
The eggs and crawlers of HWA are spread by many means, including wind, phoresy on wildlife, and anthropogenic factors ([36]). Estimations of the annual rate of HWA range expansion vary from 12.5 to 20-30 km ([36], [39]). Both short and long-distance HWA dispersal has been observed with new colonies found far ahead of the main front of the range expansion ([39]). The rate of range expansion has been notably faster pole-wards, compared to the westward, following an anisotropic pattern of spreading ([39], [49]). This pattern of spreading may be influenced by phoresy on migratory birds ([35]), as well as abundance and geographical distribution of eastern hemlock ([39]).
The continued spread of HWA coupled with effects of climate change and related range shifts are causing great uncertainty in evaluation of its impact, as well as in risk assessment and management planning ([30]). Predictive models for range expansion support forest health management assisting in preparations for potential further spread ([33]). Previous studies have investigated the potential shift of the northern HWA range in relation to winter temperatures and related HWA mortality ([41], [12], [33], [10]). Although cold temperatures are regarded as an important limiting factor for HWA populations ([53]), other factors should be investigated as well. Topographic features coupled with climate are main drivers of species distribution at a regional scale ([43]). At higher spatial resolutions, other environmental factors increase in significance, e.g., soil properties, such as soil water holding capacity, which interact with climate ([8]). Use of relevant non-climatic variables, such as topography and soil features, with climatic features can produce more robust assessments of the impacts of climate change on species ranges ([24]).
Ecological niche modeling (ENM, or species distribution modeling) is a popular approach for spatially projecting species distributions under historical (or contemporary) climate and future climate change scenarios ([43], [8]). This study represents the first use of ENMs to project suitable habitat for HWA within the introduced range of eastern North America under either historical or future climate scenarios. We also reverse-cast introduced range HWA models, projecting them back onto the native range in East Asia and West North America (i.e., reciprocal distribution modeling - [14]) in order to: (1) evaluate the sensitivity of the models to HWA occurrences in the native range as an indicator of the degree to which HWA is at equilibrium within the introduced range; and (2) project the most suitable areas in the native range for collecting potential HWA biological control agents adapted to introduced range environments. Accordingly, our primary objectives are to: (1) develop MaxEnt niche models for the introduced population of HWA in eastern North America utilizing 119 environmental variables, including climate, topography and soil features; (2) project the introduced range HWA models back onto the native range of HWA in Asia and western North America; and (3) project the eastern North American introduced range HWA models to future climates in 2050 and 2070 according to HadGEM2-ES low and high emission scenarios.
Materials and methods
Environmental predictors
In this study, we screened a large set of 119 environmental predictors at 1 km resolution for inclusion in HWA niche models, including 79 climatic variables, 16 topographic variables, 12 soil physical properties, and 12 soil suborders (Tab. S1 in Supplementary material). Soil physical characteristics and topographic variables are important as modifiers of climate, including soil water holding capacity and topographic sun exposure in future climate niche modeling ([8]). Since the hemlock woolly adelgid is dependent upon hemlock as a food source, the interaction of soil and topographic features with climate was regarded as particularly important for identifying environmental conditions suitable for hemlock. Soil features included the distribution of soil suborders that have been previously reported as associated with hemlocks ([4]) and which overlap with global Tsuga spp. distributions ([11] - Tab. S1 in Supplementary material).
Study extent and species occurrence records
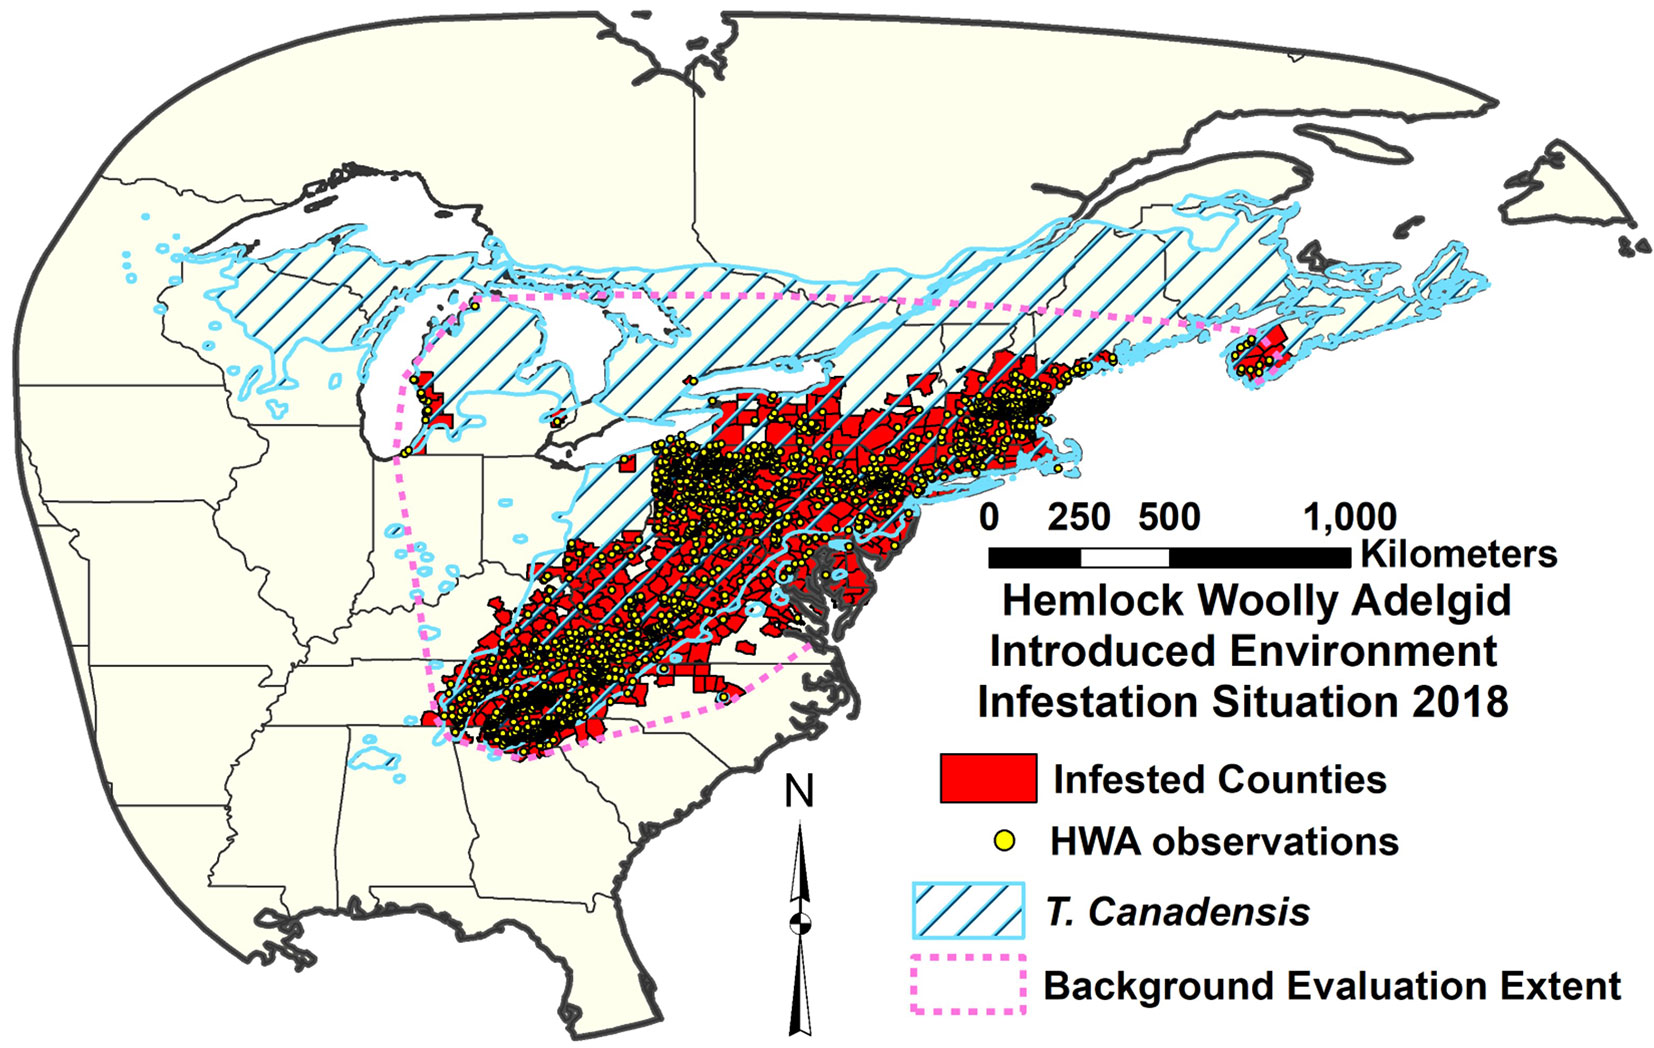
Limited samples of occurrence observations in the native range of a species may fail to approximate the extent of suitable environments, and ENMs developed from such data may lack transferability to novel regions or differing spatial scales ([38], [43]). In addition, Menke et al. ([38]) suggested that models built on occurrences from one area and projected to a highly disparate area with different environmental gradients may be prone to errors. Errors in model transferability may be more pronounced when ENMs are used in predicting range shifts of invasive species that have altered their niche requirements in their new environments ([56]). Due to the limited sparse and clustered pattern of the HWA observations in Asia, especially in the continental Asia, we only utilized HWA observations from eastern North America for developing and calibrating HWA niche models. Global HWA occurrence records were obtained from a variety of sources (see Appendix 1 in Supplementary material). Some occurrence records were downloaded from the Global Biodiversity Information Facility (GBIF) and iNaturalist or georeferenced from available HWA maps. However, most of the data were received from scientists and forest managers in the US and Canada. We gathered 4.219 HWA observation with high spatial accuracy and unique location form the eastern North America (Fig. 1). We also updated the county level infestation map according to the occurrence data set (Fig. 1).
Fig. 1 - Hemlock woolly adelgid (HWA) occurrences (n = 4,219) within the native range of Tsuga canadensis in eastern North America, including occupied counties in the US and Canada (n = 492).
MaxEnt model calibration
We developed the MaxEnt models from the introduced eastern North American HWA occurrence observations employing the “dismo” package ([22]) in R ([45]). Since the HWA population may not yet be in equilibrium and expanded to its full potential range in eastern North America, we developed a calibration background evaluation extent represented by a narrow 20 km buffer from a convex hull polygon of current presence points (Fig. 1). We generated about 10.000 pseudoabsence points within the background evaluation extent, buffered at 20 km from presence points, for model evaluation. The “PresenceAbsence” package by Freeman & Moisen ([13]) was used with presence and pseudoabsence data to calculate pseudoabsence-based (psa) versions of the True Skill Statistic (TSSpsa) and Area under the Curve statistic (AUCpsa). To reduce MaxEnt model complexity and overfitting for improved model generalization, the MaxEnt beta regularization was adjusted to two and only quadratic and hinge features were used ([58], [54]). MaxEnt models were calibrated to binary presence/absence format using a threshold at maximum TSSpsa ([31]).
Feature selection
The 119 environmental predictors were screened to produce smaller selected feature subsets for inclusion in final MaxEnt models using the random subset feature selection algorithm (RSFSA) of Tracy et al. ([54]). The RSFSA first generated hundreds of random subsets of environmental predictors (features) of specified sizes that were restricted by a correlation filter of r = |0.7| maximum inter-variable correlation ([6]). The random feature subsets were then used to develop MaxEnt models that were ranked in performance by subset wrappers of AUCpsa or the corrected Akaike information Criterion (AICc). Results were then used to select an optimal smaller subset size beyond which improvements in AUCpsa, AICc, and overfitting (AUCtest - AUCtrain; [58]) were minimal. The statistical performance of RSFSA-selected versus random MaxEnt models was evaluated after generating and ranking thousands of models for the selected subset size using held out model training and testing data (for details, see [54]). The binary calibrated twelve top RSFSA-selected MaxEnt models were combined by frequency consensus to form a feature subset ensemble (FSE).
MaxEnt model projections and range shifts
The 12 RSFSA-selected MaxEnt models calibrated for the introduced eastern North American range were first projected over a wider extent in eastern North America delimited by an 800 km buffer around the HWA occurrence observations (Fig. 1). The introduced range models were then reverse-cast projected to the species native ranges to East Asia and western North America over areas buffered from HWA occurrence observations by 2,000 km and 800 km, respectively. Presence data over much of the native HWA continental range in Asia was not available, especially west of China, making generation of pseudoabsence data outside 20 km buffers from presence data for calculating specificity and AUC more prone to error. Consequently, in order to assess the performance of HWA models generated for eastern North America on the native range, we used the sensitivity statistic, which does not require pseudoabsence data ([25]). We also calculated sensitivity reverse transferability index (sensitivity native range - sensitivity introduced range; [21]).
The 12 introduced range HWA models were also projected onto four future climate scenarios for eastern North America that were based on the Hadley Centre’s HadGEM2-ES general circulation model with low and high representative concentration pathways for CO2 emissions (RCP 2.6 and RCP 8.5) for 2050 (2050he26 and 2050he85) and 2070 (2070he26 and 2070he85). We developed change detection maps between the contemporary climate and the four future climate scenarios. The 12-model MaxEnt feature subset ensemble projection under historical climate was subtracted from ensembles of each of the four future projections. The resulting maps show the change in the number of models projecting HWA habitat suitability. We also quantified the north/south and east/west shifts in centroids for each of the 12 MaxEnt historical climate models paired with the future climate models. Mean elevations within binary historical and future climate models were also compared.
Results
Feature selection
The random subset feature selection algorithm revealed that little gain in AUC, AICc, or overfitting was achieved for MaxEnt models using feature subsets larger than six of 119 variables (Fig. S1 in Supplementary material). The six-variable MaxEnt models selected by AUC performed significantly better in terms of AUC, AICc, and overfitting compared to random six-variable models (Fig. S1). A total of 42 variables out of 119 were used in the top 12 RSFSA-selected six-variable MaxEnt models (Tabs. S1-S4 in Supplementary material). Nineteen variables were used in more than one of the top 12 models. From one to three of the six variables per model were climate variables. The percentages of variable types selected for the models were 41.7% edaphic indices, 37.3% climate indices, and 20.8% topographic indices (Tab. S1). The edaphic indices include 25% soil properties (e.g., % silt from 0-5 cm), and 16.7% soil taxonomy indices (e.g., % Ochrepts suborder per 1 km cell). From the 79 climatic layers, the evapotranspiration layers (actual and potential evapotranspiration: AET-PET) were the most often (15.2%) utilized (e.g., mean monthly November PET), followed by monthly temperature/precipitation indices (13.8% - e.g., mean maximum temperature in February), and BioClim indices (8.3% - e.g., mean temperature of the wettest quarter: bio_8). The six highest ranked variables by mean MaxEnt model permutation importance and frequency of appearance in the selected 12 models were: (1) November mean PET; (2) slope; (3) % Ochrepts soil; (4) % silt in 0-5 cm; (5) % Udepts soil; and (6) February mean maximum temperature (Tab. S2 in Supplementary material). Eight of the top 12 ranked climate variables were from the winter season. MaxEnt variable response curves indicated that intermediate levels of November PET and February maximum temperatures were optimal for HWA, as were greater slope and greater percent Ochrepts and Udepts soils. The suitability of % silt at 0-5 cm sharply peaked at around 45% (Fig. S2).
Introduced range distribution maps
The RSFSA-selected MaxEnt models under historical climate projected suitable habitat for HWA over much of the native eastern hemlock range in the US to the southernmost part of Canada (Fig. 2). The 100% model consensus area ranges approximately from 44 degrees in the northeast to 34 degrees in the South. Within the southern range, high elevation Southern Appalachians are more suitable for the species than the surrounding low elevation areas. A lower number of models projected suitability of the westernmost range for the eastern hemlock and mid- to north Nova Scotia. The northern part the hemlock range (> 45° N) was generally projected as unsuitable for HWA under contemporary climate. The 12 MaxEnt HWA models covered areas with minimum values for the minimum temperature of the coldest month (bio6) averaging (± standard deviation) -15.80 ± 0.47 °C, minimum values for the mean temperature of the coldest quarter (bio11) averaging -7.97 ± 0.46 °C, and maximum values for the maximum temperature of the warmest month (bio5) averaging 34.24 ± 0.63 °C. The corresponding extreme values for these climate features from current HWA occurrence observations in eastern North America were similar at -15.00 °C (bio6), -7.20 °C (bio11), and 32.00 °C (bio5).
Fig. 2 - Hemlock woolly adelgid introduced range MaxEnt feature subset ensemble model projection over eastern North America for contemporary climate. The scale indicates number of models in agreement on HWA suitability.
Reverse-cast native range distribution maps
The RSFSA-selected MaxEnt feature subset ensemble models developed from the HWA introduced range were reverse-cast to the native ranges in Asia and western North America and overlaid with the HWA occurrence observations and host Tsuga spp. ranges (Fig. 3, Fig. 4). The MaxEnt ensemble model projected high suitability over most of the native HWA range in Japan, Central Taiwan, and Ulleung Island, Republic of Korea (Fig. 3). The introduced range HWA models also projected suitable habitat in the continental range in Asia, but higher suitability was not as well correlated with HWA occurrences. MaxEnt model suitability was generally high for the HWA occurrences in the Cascade Mountains of West North America, with less suitability projected for HWA occurrences eastwards beyond -121.5° W in Washington, Oregon, and Idaho (Fig. 4). Sensitivity of the eastern North America HWA model projection to Asian islands did not significantly differ from sensitivity in eastern North America, but sensitivity was lower for projections to the Asian continent and western North America (Fig. S3A in Supplementary material). Sensitivity reverse transferability indices for model projections over the three native ranges of Asian continental, Asian islands, and West North America were highly variable and they did not significantly differ (Fig. S3B). There was a borderline non-significant linear trend for lower sensitivity for MaxEnt models (P = 0.061) in the Asian island range with higher numbers of climatic variables included in the models (Fig. S3D in Supplementary material).
Fig. 3 - Hemlock woolly adelgid introduced range MaxEnt feature subset ensemble model projection over native East Asian range for contemporary climate. The scale indicates number of models in agreement on HWA suitability.
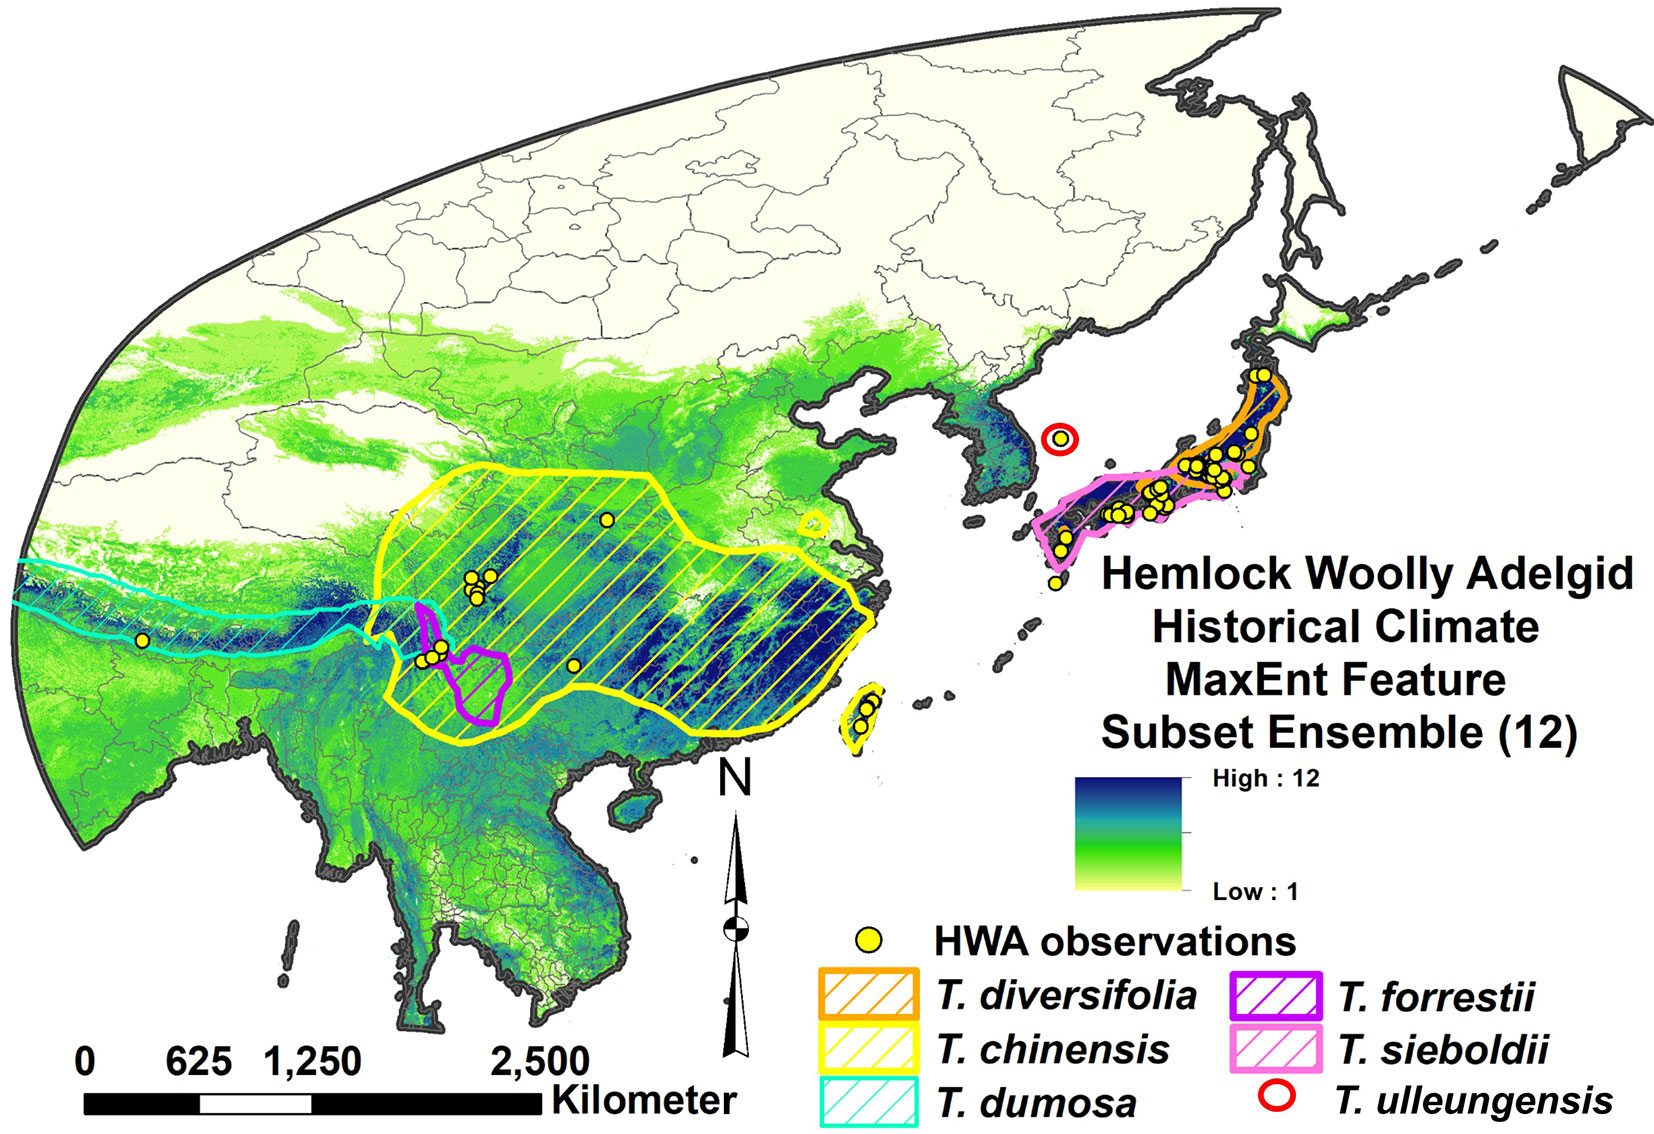
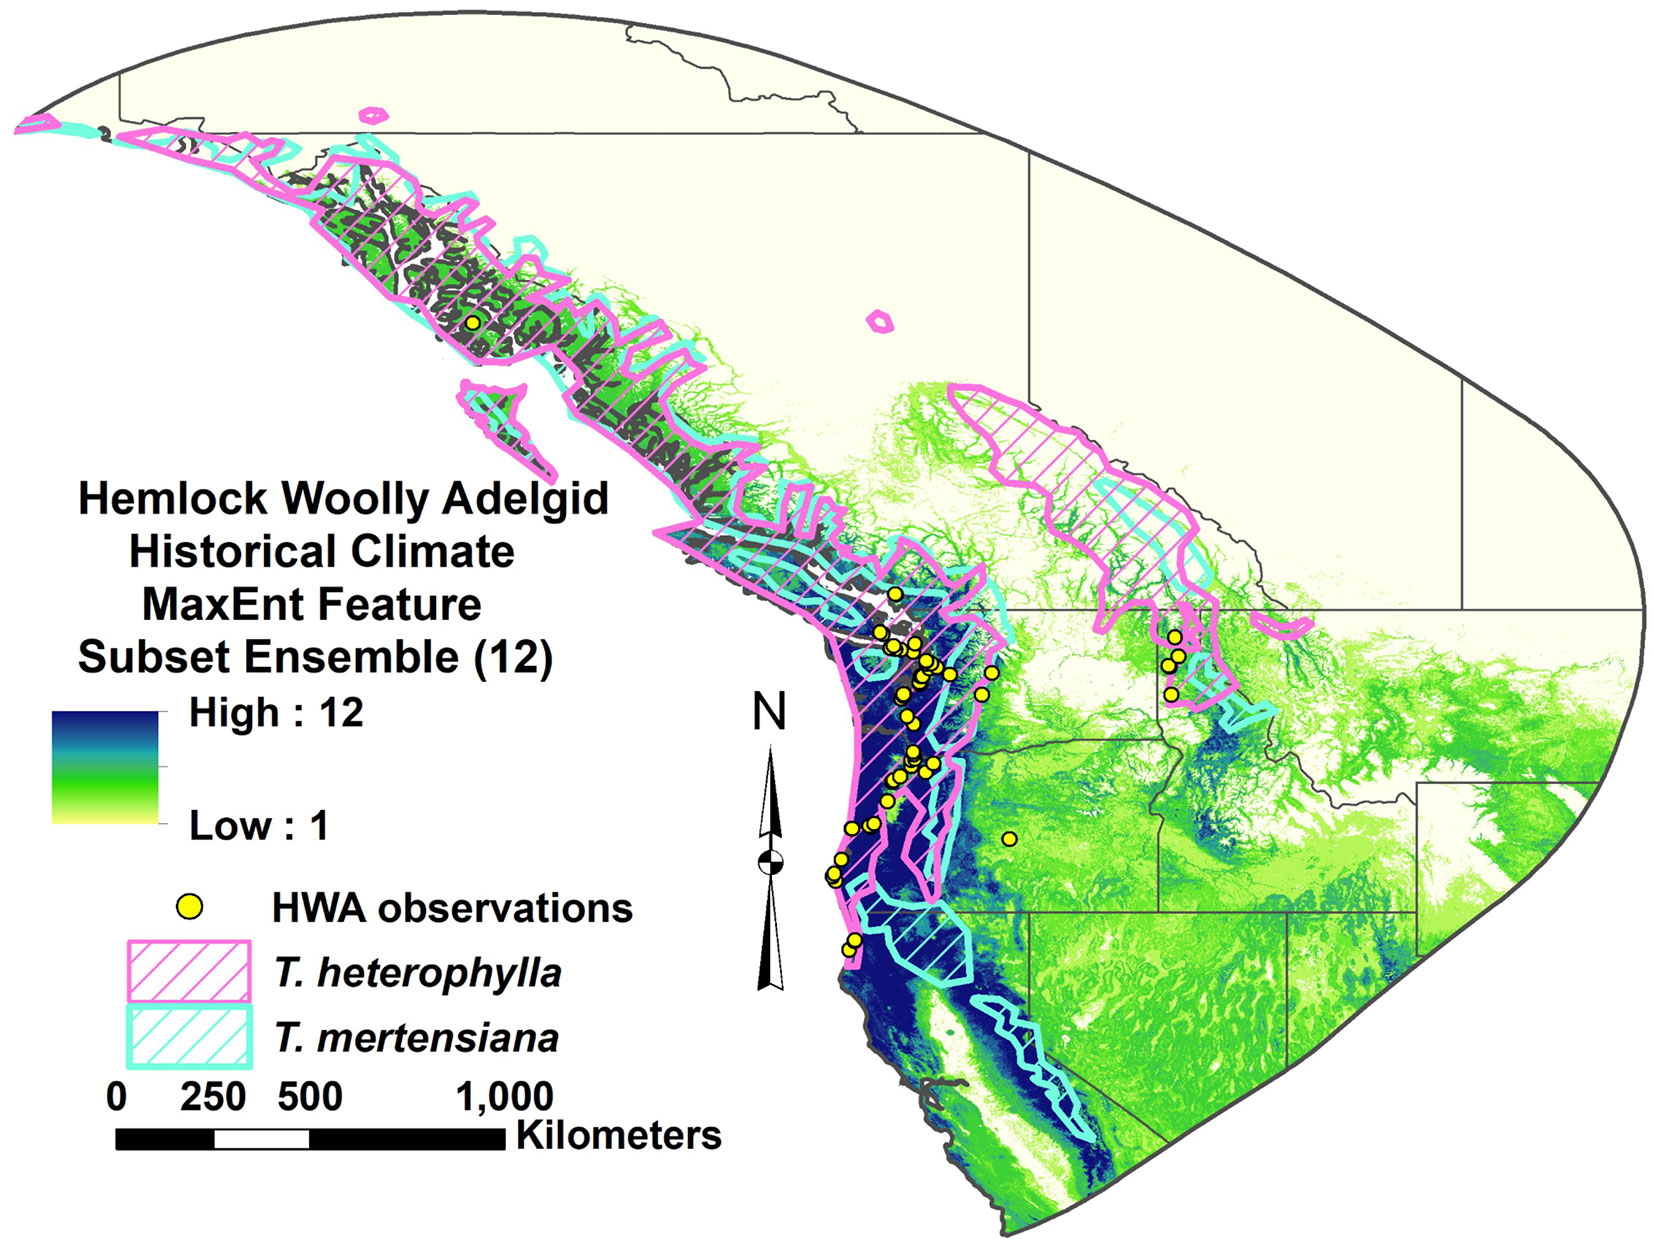
Fig. 4 - Hemlock woolly adelgid introduced range MaxEnt feature subset ensemble model projection over native western North American range under contemporary climate. The scale indicates number of models in agreement on HWA suitability.
Introduced range future climate distribution maps
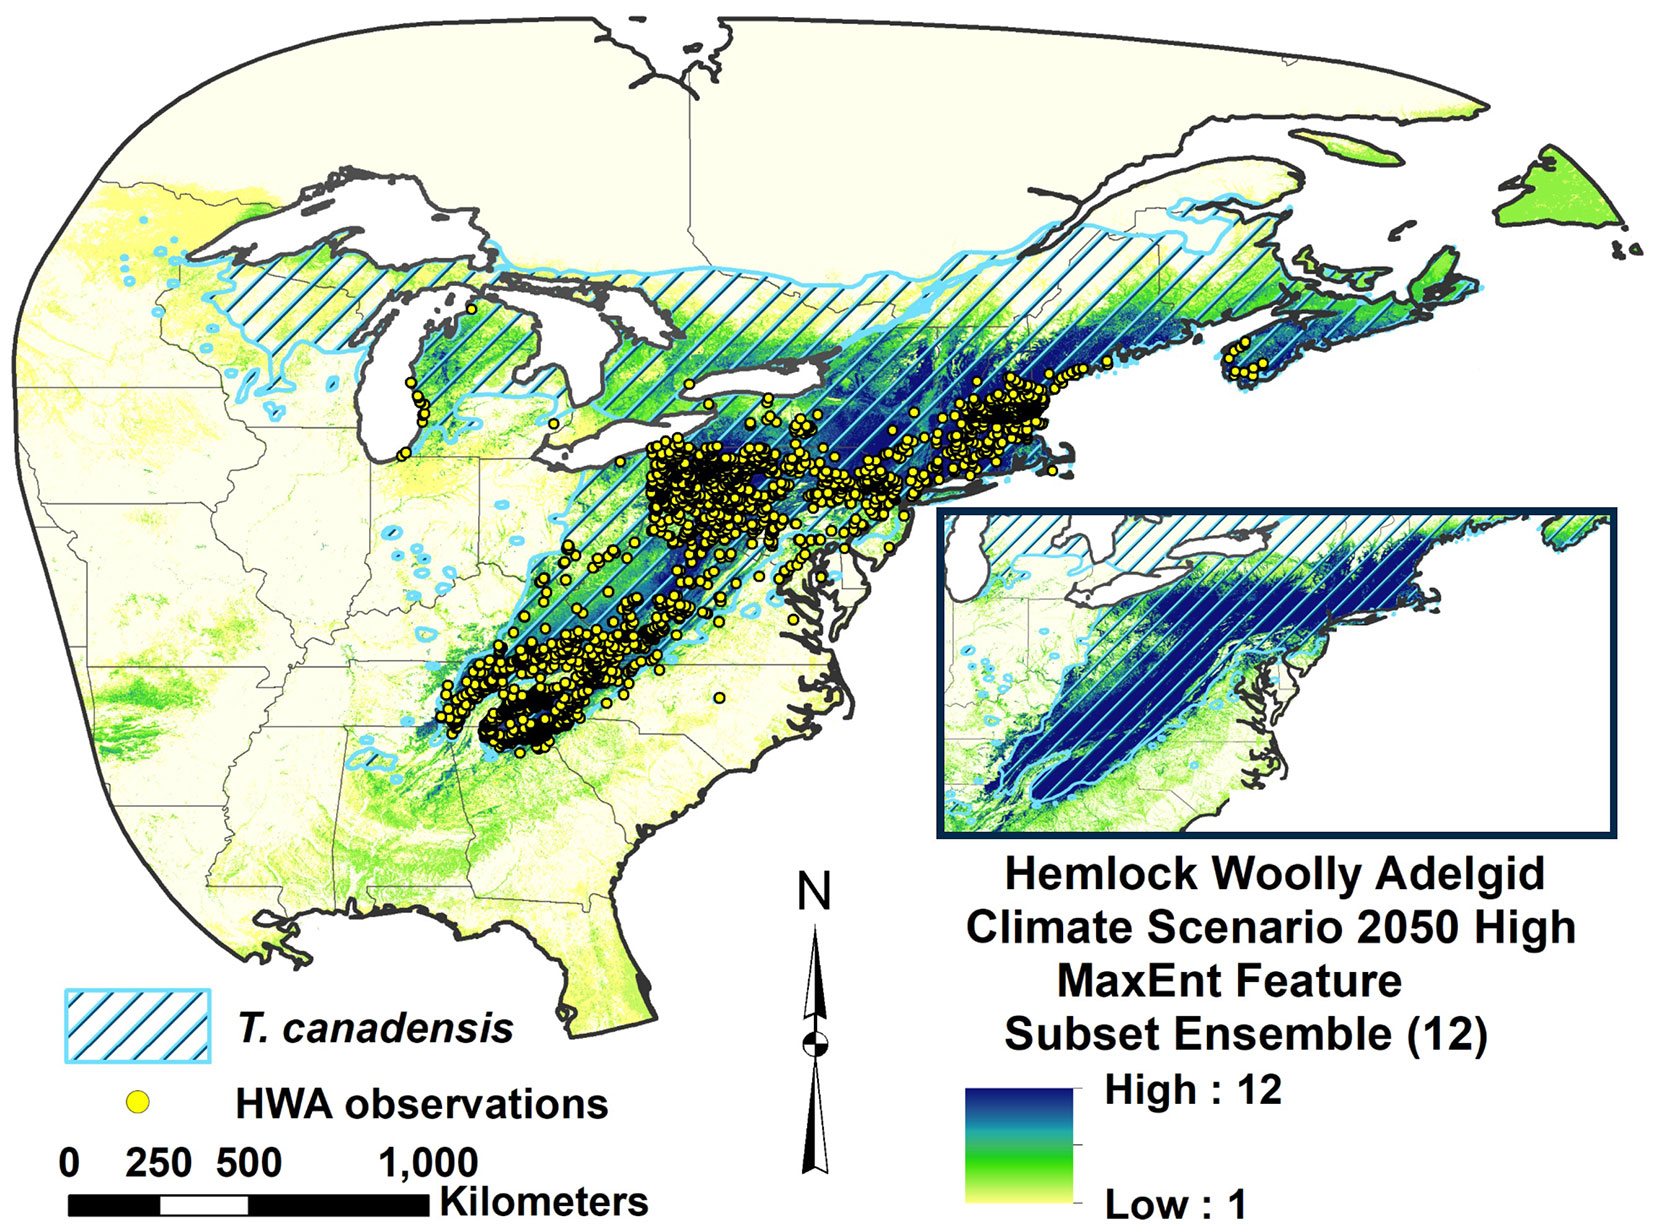
All four of the future climate RSFSA-selected MaxEnt HWA ensemble models projected expanded suitability to the north and east in North America (Fig. 5A-D, Fig. 6A-D). Both the northward and eastward shifts of the centroids of the 12 MaxEnt models were significantly different from zero for all future climate scenarios (P < 0.02; Welch t-test with Holm correction) (Fig. S4A-B). The northward shift for the high CO2 emission scenario of 2070 (2070he85) was significantly greater than shifts of the corresponding 12 models for other climate scenarios (P < 0.05; paired Welch t-test with Holm correction - Fig. S4A in Supplementary material). Under the 2070he85 climate scenario, most of the northern portion of the current native range of the eastern hemlock is projected as highly suitable for HWA. The mean estimated HWA range shifts towards the north varied between 222.12 ± 92.45 km (2050he26) and 467.64 ± 198.85 km (2070he085 - Fig. S4A). Mean eastward expansions in suitability ranged from 110.32 ± 66.24 to 164.03 ± 152.99 km, respectively (Fig. S4B). The projected suitable area for HWA did not significantly differ among historical and future climate scenarios, being especially highly variable for future scenarios (Fig. S4C). The number of climatic variables included in the MaxEnt models, ranging from one to three of six variables, produced no significant linear trend in the amount of centroid shift northwards or eastwards (P > 0.3; F-test of linear regression - Fig. S5). The mean elevation of MaxEnt model areas did not significantly differ among the future climate scenarios in either the northern or the southern portions of the HWA eastern North American range (P < 0.05, paired Welch t-test with Holm correction - Fig. S6 in Supplementary material).
Fig. 5 - Hemlock woolly adelgid introduced range MaxEnt feature subset ensemble model projection over eastern North America for four future climate scenarios: (A) 2050he26; (B) 2050he85; (C) 2070he26; and (D) 2070he85. The scale indicates number of models in agreement on HWA suitability.
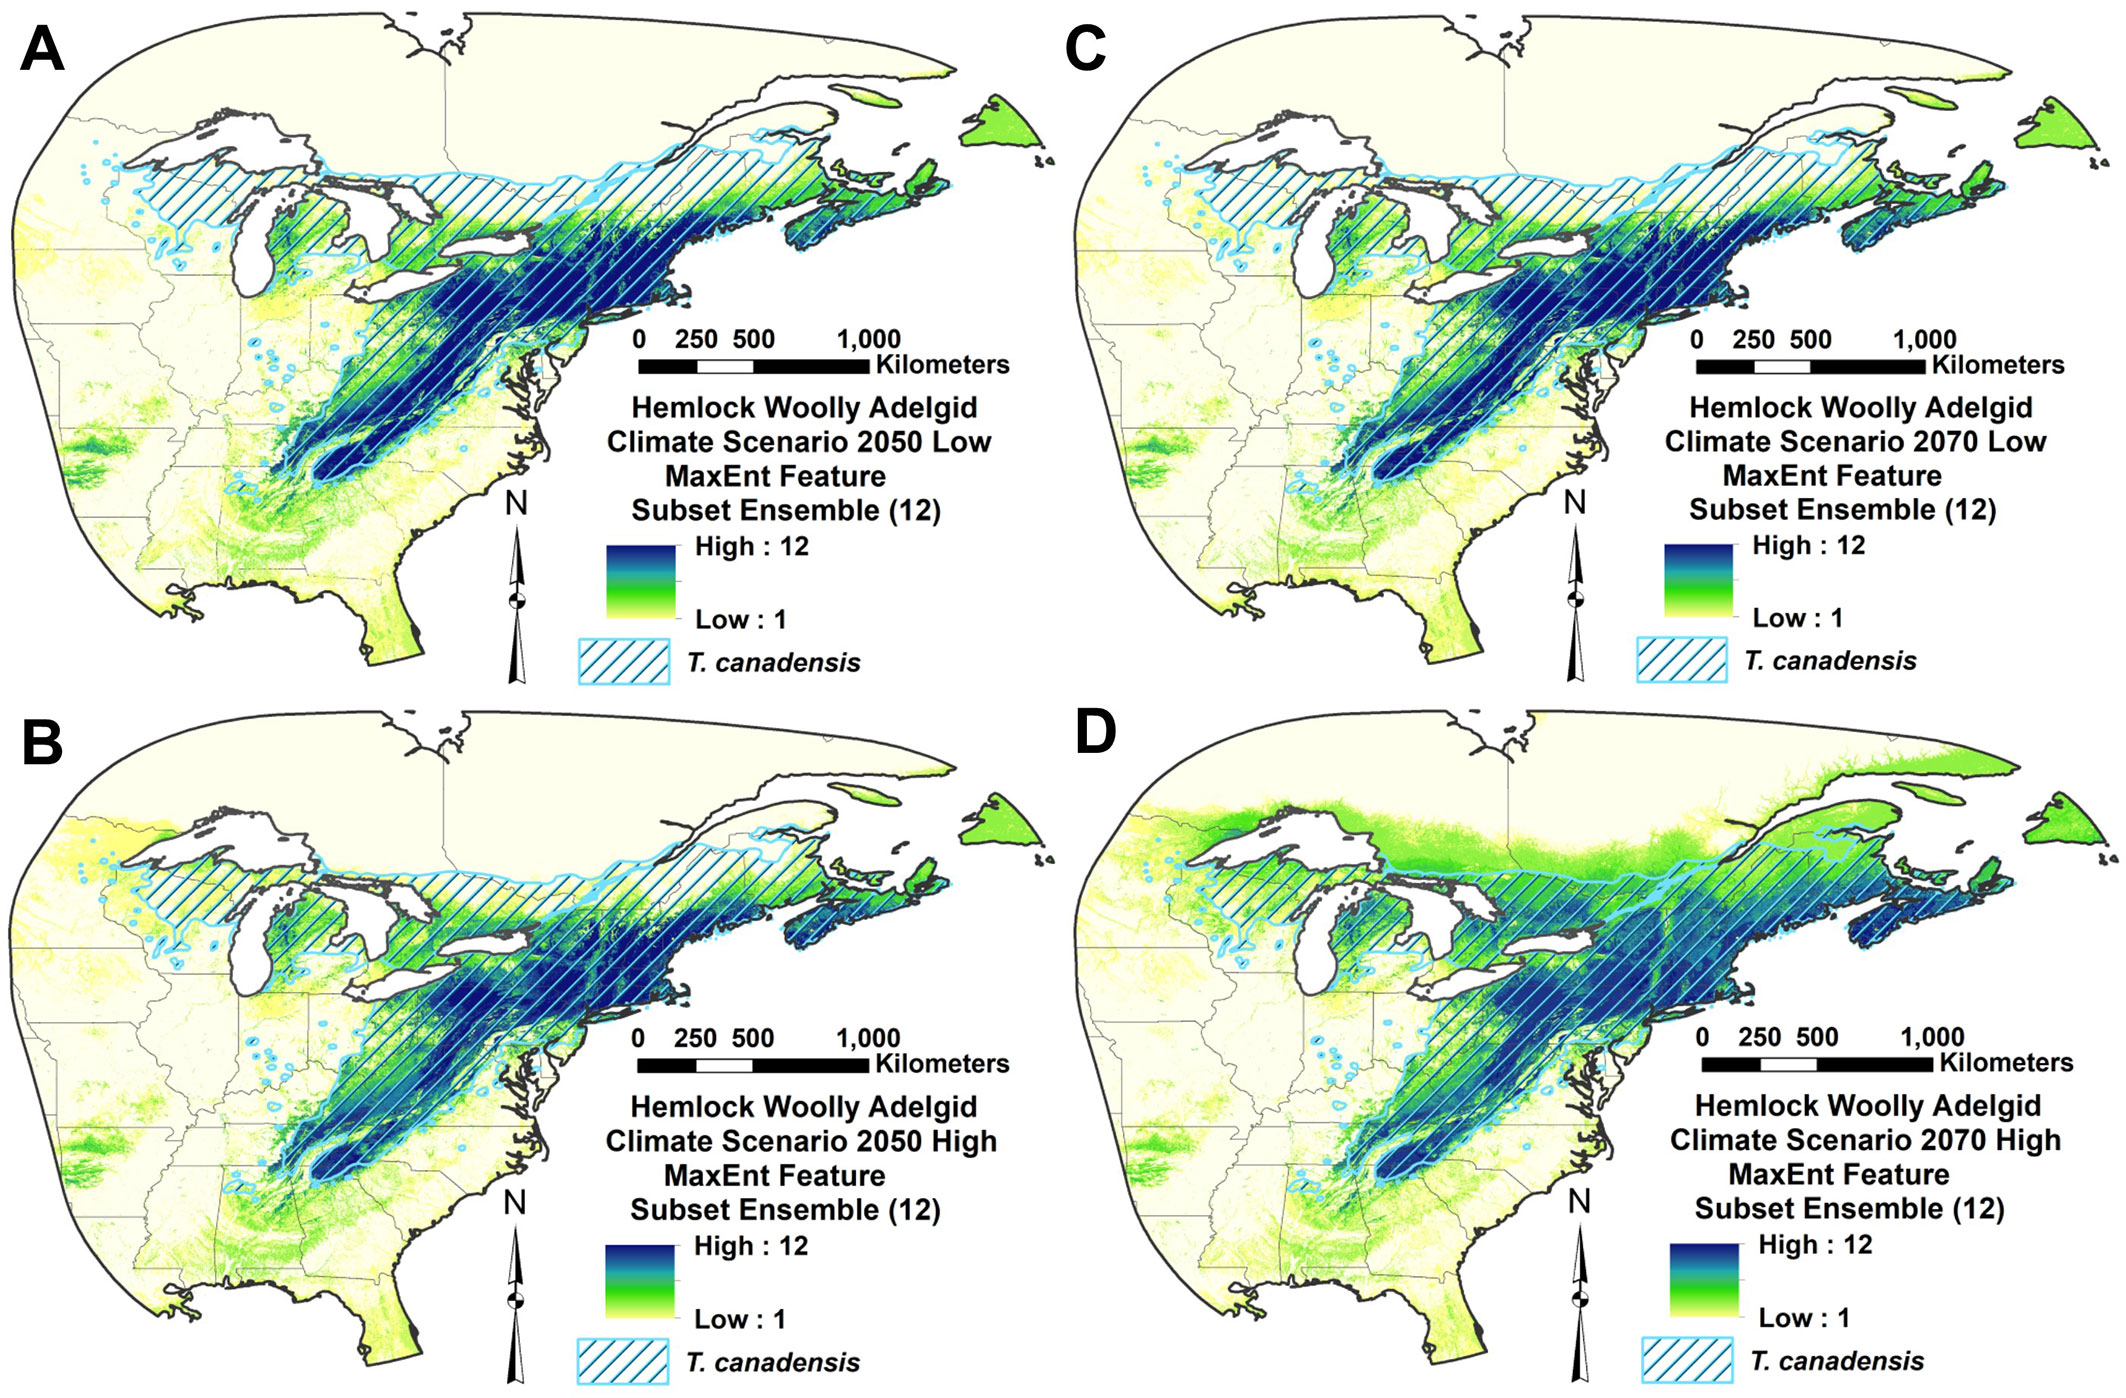
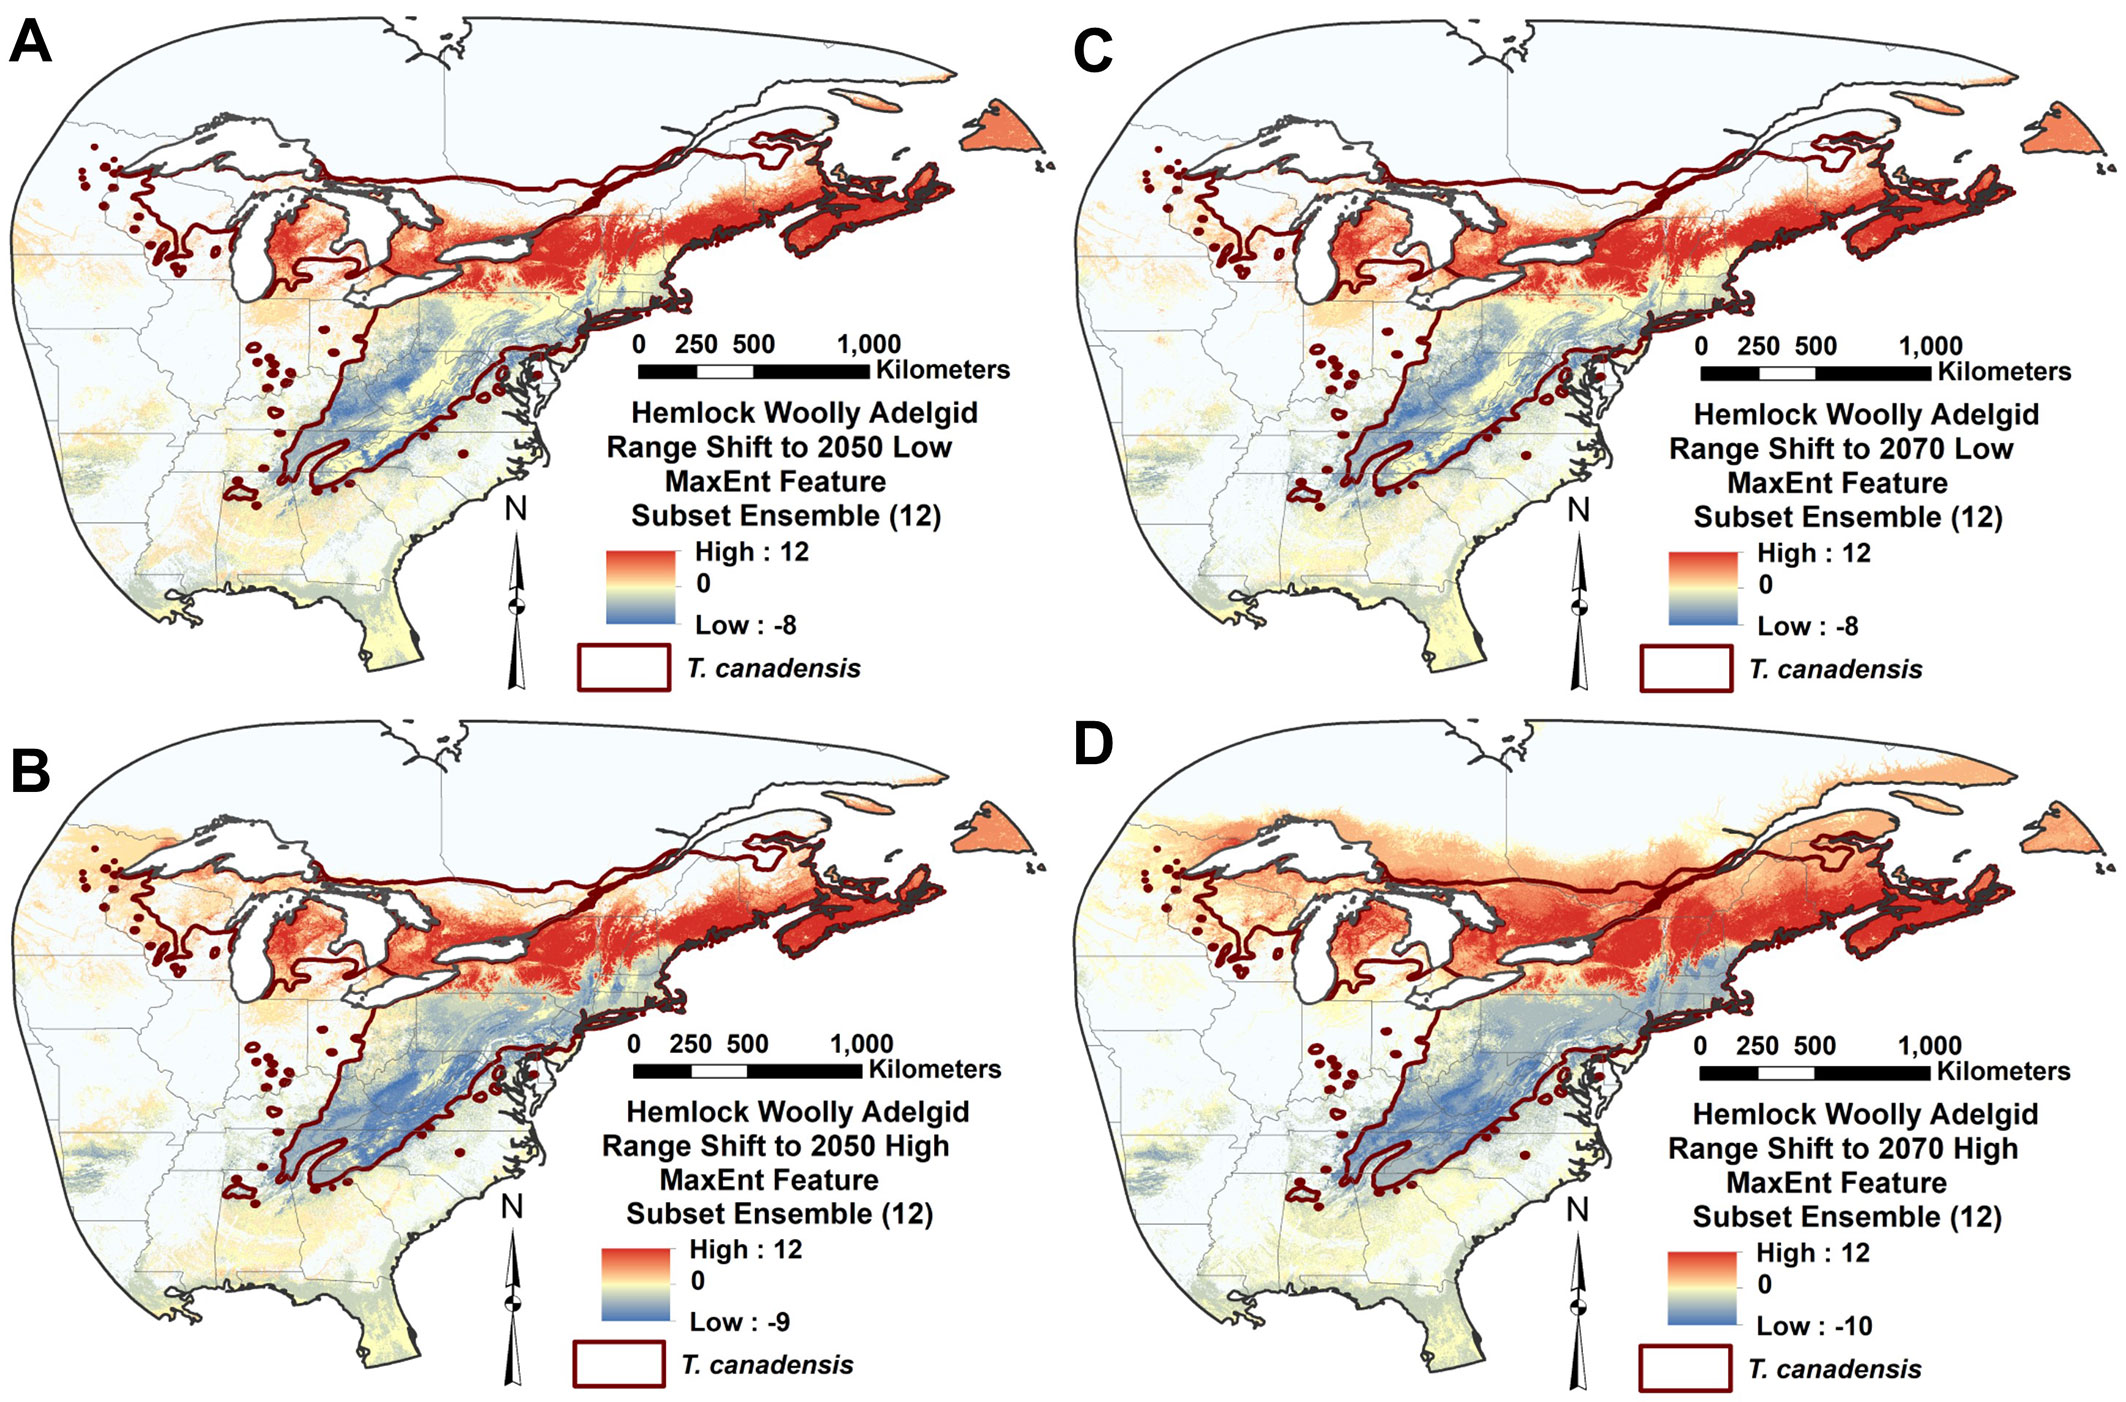
Fig. 6 - Hemlock woolly adelgid future range shift in eastern North America (red: range addition; yellow: no change; blue: range loss) represented by subtracting introduced range MaxEnt feature subset ensemble model for contemporary climate from corresponding ensemble models of four future climate scenarios: (A) 2050he26; (B) 2050he85; (C) 2070he26; and (D) 2070he85. The scale indicates change in the number of models in agreement on HWA suitability.
Discussion
Feature selection
Soil features, followed by climatic and topographic features, were the most influential variables in our introduced eastern North American range of HWA feature-selected niche models. Important soil features for HWA, such as proportion of silt from 0-5 cm and Ochrepts, probably reflect important variables for the primary HWA host of T. canadensis in eastern North America. Earlier studies developing random forest niche models for T. canadensis identified climate, land cover (e.g., % agriculture), and soil property features as important ([23], [44]). Important potential soil features for T. canadensis in these studies included soil productivity (not utilized in this study) and soil texture (% coarse soil), which relates to the silt proportion found as important in this study. Prasad et al. ([44]) reported the Inceptisols soil order as important in models for T. canadensis, which corresponds with our finding of the Ochrepts and Udepts suborders of Inceptisols as among the three most important soil suborders in the HWA models (Tab. S2 in Supplementary material). The most important climate variables previously identified for T. canadensis models were July mean temperature followed by annual precipitation ([44]), which relates to the mean January and February precipitation variables found important for HWA in this study.
Although minimum winter temperatures have been previously identified as an important limiting factor for HWA distribution in eastern North America ([41], [33], [53]), only the mean October minimum temperature was utilized among the 27 climate features selected in our 12 six-variable HWA niche models, and it was of minor importance (Tabs. S1-S2). In contrast, the feature selection method in our study identified mean November PET and mean maximum temperature for February as the most important climate variables for accurately modeling HWA distributions (Tab. S2). Although many niche modeling studies include only the 19 Bioclim variables for climate indices, the monthly AET/PET and temperature/precipitation indices were much more important in our study.
Slope was the most important topographic feature identified for HWA models in this study, being ranked as the second most important feature overall. Higher slopes probably represent an important feature of T. canadensis habitats. Finer scale (30 m resolution) topographic features, such as elevation and distance to stream, have been found to affect the landscape-level spatial pattern and performance of both HWA and hemlock hosts ([26]). However, Trotter & Shields ([55]) found that elevation explained only 2% of the variation in HWA survival in the eastern USA.
Introduced range distribution maps
The 12 feature-selected HWA MaxEnt models for eastern North America covered areas with minimum values for minimum temperature of the coldest month and mean temperature of the coldest quarter of -15.80 °C and -7.97 °C, respectively. These temperature indices correspond well to the corresponding minimum values for HWA occurrence observations of -15.00 °C and -7.20 °C, respectively. Skinner et al. ([48]) found that only 14% of the most northern HWA in eastern North America survived from exposure to -15 °C in March. Tobin et al. ([53]) also reported high HWA mortality after exposure below -15 °C. The -15 °C limit is also close to the value of -15.8 °C representing the minimum values for the average minimum temperature of the coldest month found over the areas of MaxEnt HWA models for eastern North America. Consequently, the current North American range may be close to the northern limit for HWA under contemporary climates, although, over the course of time, HWA may develop greater cold tolerance permitting northern expansion in the future ([48]). Our historical climate data represents the years 1950-2000, and the mean annual temperature has already elevated since 2000 ([7]). Consequently, the potential suitable range of HWA may have already slightly shifted towards north. According to Parmesan ([42]), numerous species have already responded to the recent reasonably mild climate change.
The current projected HWA range from our MaxEnt models covers much of the eastern hemlock distribution in the US and minor areas in southern Canada, including southern Nova Scotia. The projected range extends farther north along the Atlantic coast than it does inland. Most of the mid-continental region of the eastern hemlock range may be unsuitable, except southwestern Michigan, mainly along the coast of Lake Michigan. More maritime climate corresponds better to the native range of the species and thus may be more suitable. Under the historical climate, the northernmost part of the range of eastern hemlock above 45° N may be unsuitable for the species.
The maximum value for the maximum temperature of the warmest month within the projected HWA distribution was slightly higher than the maximum temperature found for HWA occurrence observations (34.24 °C versus 32.00 °C). The projected range of HWA extends slightly south of the range of eastern hemlock, and the host species distribution is already restricting the southern boundary of HWA occurrence. The effect of heat exposure on HWA populations is less studied. Mech ([37]) observed a cumulative effect of temperature on HWA mortality, reaching up to 100 % at temperatures above +30 °C, supporting our projections for the southern range of HWA distribution.
Reverse-casting to other regions
Similar climate between native and novel environments is considered as basic requirement of successful invasion ([52]). Optimally, models of the potential range of HWA would also be developed from Asian occurrence observations. However, large portions of the native range of HWA from China and westwards had inadequate HWA occurrence data. Menke et al. ([38]) modeled an invasive ant species distribution using data from the invaded range, and found that disparities in sampling and regional variations in the climatic conditions can induce prediction errors outside the occupied invaded area.
Although there is incomplete information on the full range of HWA range in Asia, our reverse cast projection to the native region was in general accordance with the HWA distribution in Asia, especially for island regions (Fig. 3). All 12 of the selected HWA Maxent models developed from eastern North America occurrences projected suitability in the Japanese islands, where the genotype originates. No hemlock or HWA observations have been published from the most northern Hokkaido Island, and most of this island was projected as unsuitable according to all 12 models. The MaxEnt ensemble model also projected high suitability for other known HWA populations, such as those in Taiwan and Ulleung Island of Republic of Korea ([20]). This successful projection of the introduced range model to these portions of the native range may also indicate that HWA is at or close to equilibrium in the eastern North America. The lower sensitivity of the eastern HWA model for projections to continental Asia and western North America support the Asia islands origination of the eastern North American population.
We also derived the temperature extremes for the HWA occurrence observations in Japan, and they were similar to those within the eastern North America. The minimum value for the minimum temperature of the coldest month (bio6) in Japan was -15.00 °C, and the maximum value for the maximum temperature of the hottest month (bio5) was 32.2 °C. The mean temperature of the coldest quarter in Japan (bio11: -9.6 °C) suggests higher tolerance for cold during the winter season than the results indicated by the MaxEnt models (-7.97 ± 0.63 °C). This may indicate that HWA can tolerate colder winter temperatures in eastern North America than estimated and could spread further north than our models project under historical climate.
Expansive occurrence data for the current HWA distribution in western North America was not available. However, the area of suitable habitat projected by all 12 eastern North America MaxEnt models generally matches much of the HWA occurrence observations in the region, especially along the Cascade Mountains (Fig. 4). This projected range includes most of the western portions of the native ranges of western hemlock, T. heterophylla (Raf.) Sarg., and mountain hemlock, T. mertensiana (Bong.) Carrière, from northern California to the southernmost part of British Columbia (Fig. 4). However, only a portion of the models project suitability around HWA occurrences in Idaho to the East.
The reverse-cast HWA MaxEnt models project that Japan and the Cascade Mountains region of Washington and Oregon best match environmentally with the invasive HWA range in eastern North America. These areas generally match with the sources of the primary predators introduced and established for HWA control in eastern North America, including Laricobius nigrinus (Coleoptera: Derodontidae) from western North America and Sasajiscymnus tsugae (Coleoptera: Coccinelidae), and L. osakensis from Japan ([19]). MaxEnt model projections could be used for refining collection source locations for approved or potential biocontrol agents. For example, the success of introductions of more cold tolerant strains of L. nigrinus from more interior western US locations into New England ([19], [32]) might benefit by collecting from the southernmost distributions of Tsuga spp. in Idaho and Montana, where the environment may more closely match that of the eastern HWA populations (Fig. 4).
Future MaxEnt projections
Future range shifts of forest insect pests due to the climate change in northern parts of North America and Europe are anticipated ([57], [17]). Minimum temperatures increased by 3.3 °C in southeastern US between 1960 and 2004 ([7]). During that period, outbreaks of the southern pine beetle (Dendroctonus frontalis Zimmermann) extended towards north by about 200 km. Vanhanen et al. ([57]) suggest a range shift of 500-700 km to north for the nun moth (Lymatria monacha L.) and gypsy moth (Lymantria dispar L.) in similar latitudes in Europe, by the end of this century. The phenology of HWA has already altered in western North Carolina due to milder winters ([29]).
Our models predict a range shift in the potential distribution of HWA; 221-468 km to the north and 110-164 km to the east. The major consensus of MaxEnt model projections under the high emission scenario for 2070 (2070he85) indicates HWA suitability throughout most of the northern limit of the eastern hemlock to about 46° N (Fig. 5, Fig. 6). Some of the model projections extend northwards beyond the current hemlock distribution. Small isolated areas in the North may remain uninfested by HWA according the MaxEnt projections. Paradis et al. ([41]) estimated the future HWA suitability in the northeastern US using a threshold of -5 °C of mean winter temperature. According to their higher emissions scenario, by the end of this century, all the northeastern states in the USA will be potentially suitable for HWA. Our MaxEnt projection estimates a similar range expansion. Our projected northern HWA range under high emission 2050he85 scenario roughly corresponds to the border of USA and Canada in the northeast and the latitude of ca. 35 degrees, which include wide areas in the southern Canada (Fig. 5, Fig. 6). Ellison et al. ([10]) projected similar northward HWA spread in 2050 climates, but they project further spread above Lake Ontario to 46° N, which is only projected as suitable in our later 2070he85 models. In addition, they projected no 2050 HWA spread into Nova Scotia, where HWA is currently found and which is projected as suitable in both our current and future climate HWA models. Based upon winter temperatures and related HWA mortality, McAvoy et al. ([33]) suggested that HWA may almost reach the northern range of the eastern hemlock distribution, which extends to about 46.5°-48° N. Further, they suggested that winter survival of HWA would increase in the northern latitudes amplifying the impacts.
Future projections for HWA winter mortality in eastern North America indicate decreasing mortality to the north, with less mortality around the southern tip of the Southern Appalachians ([33]). Our future HWA distribution projections similarly indicate higher suitability to the North, but they project slightly lower suitability at the southern range limits (Fig. 5, Fig. 6). Warming climate increases insect metabolism during the growing season and reduces the risk of winter mortality to insect populations ([1]). Fitness may decline if a species encounters temperatures beyond its thermal optimum level ([28]). Heat exposure may shift the southern range of HWA range to the north and upwards in the Southern Appalachians with climate change (Fig. 6), although our models projected no apparent upward shift in elevation (Fig. S6 in Supplementary material). The Southern Appalachians remain suitable within the southern part of the current hemlock range even in the high emission projection for 2070 (2070he85). There is some evidence that the rapid adaptation of insects to climate change can arise from already existing genotypes that are heat-tolerant ([42]). Sussky & Elkinton ([51]) proposed that adelgids may have adapted to higher temperatures in the south similarly to their adaption to colder temperatures in the north.
If ENM predictions are not coupled with population growth and dispersal models, they may reveal little of the extent to which the populations may actually cross new geographical barriers. Static future ENM projections are more suitable for mapping the potential range than estimating probability or timing of establishment ([12]). However, if the dispersal potential of HWA is taken into account, this species may be able to occupy the entire area of its projected ecological niche ([55]). In addition, the dispersal ability of species may evolve at the range boundaries as a response to the climate change ([42]).
In regards to projecting species range shifts, two main concerns have been raised: (1) species occurrence data do not have a stable relationship with environmental factors across space and time; and (2) future suitable environmental combinations cannot be adequately sampled ([38], [9]). In addition, adaptation during range expansion can be especially rapid in the case of invasive species ([5]). Climate change influences the host plant species as well. These potential effects are concerning for both eastern and Carolina hemlock due to their slow growth rate, restricted environmental preferences, and weak seed dispersal ([16]).
Interactions and impacts
Menke et al. ([38]) observed that abiotic climatic variables tend to be more relevant predictors over biotic variables, such as habitat related or anthropogenic variables, at coarser spatial scales. However, other factors, such as dispersal, competition, species interactions, and landscape change with various human impacts also influence distributions. Climate not only directly affects herbivorous insect populations, but may indirectly affect them by altering host plant nutrient balance and levels of secondary metabolites ([1]). Population dynamics of insect herbivores respond to a multitude of complex interactions between the insects and their natural enemies and it can be assumed that these interactions are also sensitive to temperature ([2]).
Our projected suitable areas for HWA may not fully correspond to the conditions where the species can survive and persist. Parmesan ([42]) concluded that the effects of genetic constraints and asymmetric gene flow are more pronounced close to the borders of distributions, which could also lead to lower survival. On the northern edges of our projected distribution, lower survival may give rise to isolated local HWA populations with much lower impacts on hemlock communities and ecosystems.
Introduced invasive species are difficult to eradicate ([46]), and prevention of introduction of these species is the most effective form of forest health protection - [52]). Management of HWA to mitigate negative impacts is challenging. Trotter & Shields ([55]) outlined four reasons for the rapid spread rate and high impacts of HWA in eastern North America: (1) the species has bivoltine and parthenogenic life cycle, which allows for more rapid reproduction and reduces the Allee effect since the population is not dependent on sexual reproduction; (2) HWA is lacking native predators and parasites, despite major biocontrol efforts with introduced enemies; (3) HWA has many vectors increasing the dispersal potential; and (4) eastern and Carolina hemlocks have overall very poor resistance against the species, although increased density of HWA in a tree can decrease the suitability of a host hemlock. Although the HWA in eastern North America originates from a single genotype reproducing by parthenogenesis ([20]), the introduced population seems to have a high spreading potential and ability for rapid adaptation ([42]). These factors may indicate that the changing climate may not have high negative impacts on HWA. Impacts of HWA on hemlock communities may even be pronounced in the future taking the slow adaptation of the hemlock species into account.
Significant impacts of invasive species are determined by more than only their presence in an area ([3]). Impacts of non-native species are difficult to predict and the intensity of impacts may vary greatly within the invaded area ([27]). Impacts can be assumed less severe at the edge area of suitability. However, lower suitability of the conditions for the host species may increase the risk of high impacts. ENM techniques can be used for modeling risk of invasion using locations with high abundance of an invasive species ([27]). High abundance correlates more strongly with the high impact risk than simple occurrence data. In the case of HWA, this kind of abundance data is not available. Adequate abundance data for ENM modeling is rarely collected, especially for invasive species ([3]). More research is needed on factors affecting HWA abundance at a local scale, including anthropogenic factors, to estimate the risk of high impacts.
McClure ([34]) observed higher densities of HWA in Japan on ornamental hemlocks than in hemlocks growing in forests, which he attributed to forests having less optimal conditions for HWA and higher abundance of natural enemies. Morin et al. ([39]) found that the abundance of host trees appears to be a major factor in the rate of spread of HWA. Nutritional value and resistance ability, i.e., quality of the host trees may be another important factor for successful HWA invasions. For example, trees in mountainous areas, where they are stressed by climate, may be more vulnerable ([40]). The interactions between HWA and hemlocks as well as effects of host tree quality on risk of invasion and intensity of the impacts should be studied further.
Conclusions
The hemlock woolly adelgid is a significant mortality agent threatening hemlock species and related ecosystems of eastern North America. Eradication of the species is difficult and forest health planning and prevention from introduction are the most effective methods to mitigate the impacts of HWA. MaxEnt models for the invasive range of HWA in eastern North America are influenced by a combination of edaphic, climatic, and topographic variables. The minimum values of -15.8 °C for the mean minimum temperature of the coldest month over the range of MaxEnt model projections closely aligns with the minimum -15 °C value for HWA occurrences and the observed field cold tolerance of around -15 °C. In addition, sensitivity of HWA projections are fairly high in the Asian native range with reverse-casted MaxEnt models for eastern North America, especially for the region of the source population in Japan. Consequently, the HWA distribution may be nearing equilibrium in eastern North America. Significant range shifts of 221-468 km northwards and 110-164 km eastwards were projected by 2050 to 2070. By 2070, most of the northeastern range of the eastern hemlock may be suitable for HWA infestation.
Acknowledgments
This study was made possible by financial aid from the Finnish Academy project “Centre of Excellence in Laser Scanning Research” (CoE-LaSR, decision number 272195) and the University of Helsinki project “Towards semi-supervised characterization and large-area planning of forest resources using airborne laser scanning data acquired for digital elevation modeling”. We want to thank Christen Carrington, Joseph Culin, Denise Dodd, Mark Faulkenberry, Nathan Havill, Nathan Hoover, Craig Largenaire, Tom Macy, Tom McAvoy, Deborah McCullough, Michael Montgomery, Ron Neville, Abe Nielsen, Scott Salom, Bill Trescott, Richard Turcotte, and Jennifer Weimer for their kind help providing accurate HWA records and enabling this study.
Author Contributions
Tuula Kantola had a leading role in the study design, data preparation, analysis, and writing of the paper. James Tracy had a co-leading role in data analysis and writing. Antonio Trabucco prepared additional data for analysis. All the authors contributed to the study design, writing, and commenting of the content.
Conflicts of Interest
The authors declare no conflict of interest.
References
CrossRef | Gscholar
CrossRef | Gscholar
CrossRef | Gscholar
Gscholar
CrossRef | Gscholar
Gscholar
Gscholar
CrossRef | Gscholar
Authors’ Info
Authors’ Affiliation
Päivi Lyytikäinen-Saarenmaa 0000-0003-1884-3084
Hannu Saarenmaa
Markus Holopainen
Department of Forest Sciences, University of Helsinki, P.O. Box 27, FI-00014 Helsinki (Finland)
Robert N Coulson
Knowledge Engineering Laboratory, Department of Entomology, Texas A&M University, College Station, TX 77843-2475 (USA)
Euro-Mediterranean Center on Climate Change, IAFES Division, Sassari (Italy)
Corresponding author
Paper Info
Citation
Kantola T, Tracy JL, Lyytikäinen-Saarenmaa P, Saarenmaa H, Coulson RN, Trabucco A, Holopainen M (2019). Hemlock woolly adelgid niche models from the invasive eastern North American range with projections to native ranges and future climates. iForest 12: 149-159. - doi: 10.3832/ifor2883-012
Academic Editor
Massimo Faccoli
Paper history
Received: Jun 05, 2018
Accepted: Jan 26, 2019
First online: Mar 04, 2019
Publication Date: Apr 30, 2019
Publication Time: 1.23 months
Copyright Information
© SISEF - The Italian Society of Silviculture and Forest Ecology 2019
Open Access
This article is distributed under the terms of the Creative Commons Attribution-Non Commercial 4.0 International (https://creativecommons.org/licenses/by-nc/4.0/), which permits unrestricted use, distribution, and reproduction in any medium, provided you give appropriate credit to the original author(s) and the source, provide a link to the Creative Commons license, and indicate if changes were made.

Web Metrics
Breakdown by View Type
Article Usage
Total Article Views: 36640
(from publication date up to now)
Breakdown by View Type
HTML Page Views: 30018
Abstract Page Views: 3282
PDF Downloads: 2733
Citation/Reference Downloads: 5
XML Downloads: 602
Web Metrics
Days since publication: 1877
Overall contacts: 36640
Avg. contacts per week: 136.64
Article Citations
Article citations are based on data periodically collected from the Clarivate Web of Science web site
(last update: Feb 2023)
Total number of cites (since 2019): 7
Average cites per year: 1.40
Publication Metrics
by Dimensions ©
Articles citing this article
List of the papers citing this article based on CrossRef Cited-by.
Related Contents
iForest Similar Articles
Research Articles
Development of monitoring methods for Hemlock Woolly Adelgid induced tree mortality within a Southern Appalachian landscape with inhibited access
vol. 9, pp. 178-186 (online: 02 January 2016)
Research Articles
Spatial modeling of the ecological niche of Pinus greggii Engelm. (Pinaceae): a species conservation proposal in Mexico under climatic change scenarios
vol. 13, pp. 426-434 (online: 16 September 2020)
Research Articles
Local ecological niche modelling to provide suitability maps for 27 forest tree species in edge conditions
vol. 13, pp. 230-237 (online: 19 June 2020)
Research Articles
Predicting the impacts of climate change on the distribution of Juniperus excelsa M. Bieb. in the central and eastern Alborz Mountains, Iran
vol. 11, pp. 643-650 (online: 04 October 2018)
Research Articles
Climate change may threaten the southernmost Pinus nigra subsp. salzmannii (Dunal) Franco populations: an ensemble niche-based approach
vol. 11, pp. 396-405 (online: 15 May 2018)
Research Articles
Predicting impacts of climate change on forest tree species of Bangladesh: evidence from threatened Dysoxylum binectariferum (Roxb.) Hook.f. ex Bedd. (Meliaceae)
vol. 10, pp. 154-160 (online: 25 May 2016)
Research Articles
Fluctuation of the ecological niche of Moringa peregrina (Forssk.) Fiori with topoclimatic heterogeneity in southern Iran
vol. 16, pp. 53-61 (online: 16 February 2023)
Research Articles
Predicting the effect of climate change on tree species abundance and distribution at a regional scale
vol. 1, pp. 132-139 (online: 27 August 2008)
Research Articles
Effect of imperfect detection on the estimation of niche overlap between two forest dormice
vol. 11, pp. 482-490 (online: 18 July 2018)
Research Articles
Estimating the potential threat of increasing temperature to the forests of Turkey: a focus on two invasive alien insect pests
vol. 15, pp. 444-450 (online: 03 November 2022)
iForest Database Search
Google Scholar Search
Citing Articles
Search By Author
Search By Keywords
PubMed Search
Search By Author
Search By Keyword