Quantifying and modeling water availability in temperate forests: a review of drought and aridity indices
iForest - Biogeosciences and Forestry, Volume 12, Issue 1, Pages 1-16 (2019)
doi: https://doi.org/10.3832/ifor2934-011
Published: Jan 10, 2019 - Copyright © 2019 SISEF
Review Papers
Abstract
Climatic water availability is a major determinant of forest structure and composition, while drought events may severely impact forest dynamics. In recent decades, an increasing number of severe drought events has been reported in forests around the world. In the future, climate models project increasingly dry conditions in many temperate regions. Various tools have been applied to better understand the effects of drought on forests, such as dendrochronological analyses, climatic trend analyses and dynamic models. With these approaches, water availability is often summarized as a single scalar, termed a drought or aridity index. As droughts are complex phenomena, such indices are always associated with a loss of information. Many different such indices exist, and have been developed for various purposes. This review asks whether some of these indices are more suitable than others to quantify water availability in temperate forests. In a first step, the rationale and theoretical background of different drought indices are spelled out and compared among each other. Then, evaluations and intercomparisons of drought indices from the literature are reviewed. The implementation of drought indices in dynamic forest models is also discussed. Finally, two current research questions are identified: the role of dry air for physiological drought, and the suitability of various drought indices under climate change. It appears from this review that indices accounting for evaporative demand generally perform better than indices based on precipitation alone. When comparing sites with different edaphic conditions, indices accounting for soil moisture storage are more suitable. Nevertheless, results from intercomparisons show considerable divergence, and it is not possible to clearly favor one index. Furthermore, a differential response of tree species to different drought indices is often observed, although no clear pattern emerges from this comparison. More intercomparisons of indices, across climates and species, might provide valuable knowledge. Another key finding is that the properties of indices also depend on choices regarding, e.g., the calculation of evaporative demand, or the underlying water balance model. Reporting such methodological details could greatly increase the value of future evaluations of drought indices.
Keywords
Drought Indices, Water Availability, Soil Moisture, Climate Change, Dynamic Forest Modeling
Introduction
Water availability has long been recognized as one of the major determinants of vegetation composition, structure and dynamics ([25], [80]). The water regime characterizing a location is defined not only by long-term sums of water supply and demand ([11]), but also by their temporal distribution ([65]) and the frequency and intensity of drought events ([100]).
In recent years, a large number of studies have reported increasingly severe effects of water shortage on forests around the world ([1]), including episodes of large-scale diebacks and sudden drops in productivity after extreme droughts ([10]) as well as chronic increases in tree mortality and growth decline ([13]). The increasing severity of droughts is driven not only by changes in precipitation, but also by rising temperatures, which increase the evaporative demand ([10]). In the context of ongoing and predicted climate change, substantial impacts are expected on forests in many parts of the world and threaten their ecosystem services ([1]). Therefore, understanding how droughts impact forest productivity and tree mortality is essential to devise adaptive forest management strategies ([47]). In recent years, the physiology of plants under water shortage has been the subject of intensive research, leading to many insights into the mechanisms by which drought impacts tree growth and mortality.
In addition to mechanistic approaches, methods to derive statistical and empirical relationships between water availability characteristics and physiological impacts are important tools in drought-related research. Such relationships are useful for: (1) retrospective analyses of drought impacts on forests, e.g., through the study of tree-ring chronologies; (2) assessments of temporal trends in water availability; (3) site characterization and assessments of species suitability under present and predicted climates; and (4) representing the effects of drought on growth, mortality and establishment in dynamic forest models. The last point does not refer to mechanistic models which explicitly simulate water uptake and use, combined with photosynthesis and subsequent allocation of carbohydrates ([40]), but to gap and forest landscape models, which typically operate on a coarse time scale (monthly to annual). In all these cases, water availability is expressed as a scalar, termed drought index. As droughts are complex phenomena ([55]), such indices cannot capture all dimensions of drought events, and must be chosen depending on the question at hand. Many drought indices have been proposed, and several reviews exist ([39]). However, these reviews focus on meteorological, agricultural or hydrological aspects of drought, and many of the indices typically used to describe forest drought are absent. The aim of this review is to provide an overview of indices used to describe water availability in forests in the four areas of application outlined above. Indices are sometimes described as “physiologically-based” or “ecologically meaningful”, often without any further exploration of what these terms mean. Therefore, this review also aims to clarify the assumptions behind the different indices, and how they relate to physical and ecohydrological theory. Based on experiences reported in the literature, this review further asks whether some indices can be considered more suitable than others for each of the applications described above. All indices that have been used for one of the four purposes listed above were considered.
Some of the terms used in this context are ambiguous, or used interchangeably by different authors. Moreover, the term “drought” itself has different meanings, overlapping to various degrees. Therefore, the next section clarifies the use of these terms throughout this review. The section “Drought and aridity effects on trees and forests” gives a brief overview of the state of the research on water availability impacts on trees and forests. The various indices are presented in the section “A classification of drought and aridity indices”, in order of increasing complexity. The section “Intercomparisons and evaluations of drought and aridity indices” summarizes the studies in which various indices have been compared with each other or with measurements. In the section “Water availability indices in dynamic forest models”, the application of water availability indices in dynamic forest models is discussed. The section “Current debates and open questions” identifies and discusses open questions, and outlines possible further areas of research. Finally, a synthesis of the review in light of the research questions presented in the last paragraph are provided in the section “Synthesis and conclusions”.
Definitions
In this review, a distinction is made between drought (an anomalously dry period under a given climate) and aridity (a feature of climates with low water supply relative to evaporative demand), although these terms are sometimes used interchangeably in the literature. It is acknowledged, however, that a sharp distinction is impossible, especially in the case of sessile and long-lived organisms such as trees. Indeed, a single drought event can have consequences that last for several years, and may interact with other disturbances, including new droughts. Also, droughts themselves may last for several years, such as the recent dry spells in North America and China. Under a changing climate, trends in water supply and temperature can lead to long-term aridification at a given location. Lastly, the frequency and intensity of droughts are an important feature of a region’s climate and contribute to shaping the structure and composition of ecosystems ([100]).
A common element to most concepts of drought (see [55]) is its definition as a period of abnormally low precipitation (or precipitation minus evaporation), streamflow or soil moisture. These three variables form the basis for a widely used ([39], [55]) classification of drought conceptualizations into meteorological, hydrological and soil drought (the latter is also termed “agricultural drought”). Drought concepts based on other variables are also used, e.g., the concepts of groundwater drought or socio-economic drought proposed by Mishra & Singh ([55]). From the perspective of vegetation science, the term “physiological drought” ([62]) refers to a period in which plant functioning is impaired due to a lack of available water. As soil moisture is the main source of water for most forest trees, physiological and soil drought are often well correlated in space and time. A difference between the two concepts resides in the fact that plant-specific regulation mechanisms modulate the characteristics (i.e., intensity and duration) of plant-internal water deficits ([62]). Plant-internal water deficits may also be caused by high atmospheric evaporative demand, even with ample soil moisture ([85]). However, as vegetation water use feeds back to the soil moisture state, soil drought and physiological drought are intimately coupled. Some of the indices reviewed here have been developed to describe meteorological or soil drought, but in vegetation science, their role is to serve as proxies for physiological drought.
By definition, temperate forests grow in regions where aridity is low in global comparison. Nevertheless, water availability is one of the main determinants of forest composition and structure across temperate regions. Aridity may be conceptualized as the long-term ratio or balance of precipitation and atmospheric evaporative demand ([11]). This ratio is a strong predictor of catchment-integrated evaporation ([11], [98]), which is closely linked to biological productivity. Still, other climatic and environmental factors can modulate the effect of dryness on ecosystems. The temporal distribution of water supply and demand influences the availability of water when it is most needed by the vegetation, i.e., in periods of high evaporative demand or during key physiological processes. For example, for a given annual or seasonal precipitation sum, storm intermittency determines the length of dry periods, so that more intermittent storms translate to drier conditions for the vegetation ([98]). In addition, a concentration of rain to fewer, more intense events may mean that a greater fraction of rain goes to runoff, reducing the amount of available water ([65]). Effective water availability also depends on physiographic aspects such as slope, soil water holding capacity or permeability, which control the partitioning of water between runoff and soil moisture storage ([25], [65], [98]). In this review, “aridity” is loosely defined as reduced water availability due to climatic, and possibly physiographic, factors.
The term “stress” is often used in conjunction with drought, but not always explicitly defined. According to Gaspar et al. ([31]), stress is used to describe either an environmental factor (biotic or abiotic) that has the potential to affect an individual organism’s functioning; an organism’s response to such adverse conditions; or the physiological state resulting from such conditions. The authors favor the latter definition, but note that for sessile organisms such as plants, the physiological state is intimately linked to environmental conditions. This definition is practically identical with the definition for physiological drought discussed above. Porporato et al. ([65]) proposed a phenomenological but quantitative description of water stress, based on soil moisture deficit as well as plant-specific sensitivities and responses. The various adaptations of vegetation to environmental conditions reduce water stress, e.g., by avoiding excessive soil moisture depletion ([25]). In the case of forests, the adaptation of vegetation properties to water availability is well documented ([33]). Some authors ([3]) have argued against the use of the term “stress” to describe long-term conditions that lead to adaptations such as slow growth rates or small leaf area. Indeed, Anfodillo et al. ([3]) show that these adaptations allow plants to maximize their fitness in the given environment. In this review, the term stress is used in the narrow sense of physiological drought.
Drought and aridity effects on trees and forests
This section briefly summarizes the state of knowledge on the impacts of water shortage in forests. This summary is not exhaustive and has the purpose to provide context for the interpretation of the various indices in the next sections. For a more complete treatment of the matter, the reader is referred to the various reviews cited here, at the scale of biochemical processes ([15], [42]), individual trees ([50], [51]) and forest stands ([16]).
Water is crucial for a wide range of plant physiological processes: cell survival (matrix for biogeochemical reactions, turgor), cell growth, and transport of nutrients and photosynthesis products. In addition, the water and carbon budgets of a plant are closely linked, as plants use the same pathway (the stomata) for transpiration and CO2 assimilation. A schematic representation of the various physiological mechanisms of drought stress is given in Fig. 1. A decrease in plant water status, induced by reduced soil moisture availability (or high atmospheric demand) has a number of quasi-immediate effects. Among the first reactions is a reduction of cell growth and cell-wall synthesis, due to the reduction of within-cell water potential ([42], [65]). In the xylem, a decrease in water potential leads to an increasing occurrence of embolism, i.e., the presence of air bubbles blocking the conduits ([51]). While embolized conduits can be repaired, the plant’s ability to do so decreases as drought progresses. This interruption of the internal water flow may lead to the desiccation of leaves and branches, and ultimately to whole-tree mortality. In the short term, plants can regulate their water status by partially or fully closing their stomata. However, stomatal closure over a longer period has a number of adverse effects on the plant, the most direct being a reduction in assimilated carbon. Under severe water deficit, the reduction of available carbon may be further accentuated by the difficulty in transporting carbohydrates in the phloem ([51]) and a metabolic down-regulation of photosynthesis ([15]). Under these conditions, the allocation patterns are modified: less carbon is used for growth, and more is stored in the form of carbohydrates. This allows the plant to sustain processes critical to its survival, such as maintenance respiration and the repair of embolized xylem conduits. The last point shows the interconnectedness of metabolic and hydraulic aspects of drought stress ([51]). While the plant may down-regulate respiration to some extent, photosynthesis often decreases much faster and earlier than respiration ([51]). A sustained reduction in carbon availability (due to limitations in photosynthesis and assimilate transport) may lead to a depletion of carbohydrate storage, up to the point where the plant cannot sustain its respiration needs.
Fig. 1 - Schematic overview of the effects of water shortage on tree physiology and forest stand dynamics, at various spatiotemporal scales. Red squares indicate quantities that typically decrease with water shortage, and blue squares denote quantities that tend to increase. Solid arrows indicate a direct causal relationship, whereas dashed arrows indicate possible mitigation strategies. Starting from a reduction in plant water status, the diagram shows several interconnected pathways in which physiological drought affects growth and mortality: reduction in cell enlargement, increased risk of damage to the hydraulic architecture, and reduction of carbon and nutrient uptake due to stomatal closure. These processes also interact with additional sources of stress, such as heat or biotic agents. At longer time scales, aridity may affect stand-scale characteristics such as canopy height, stand density or LAI.
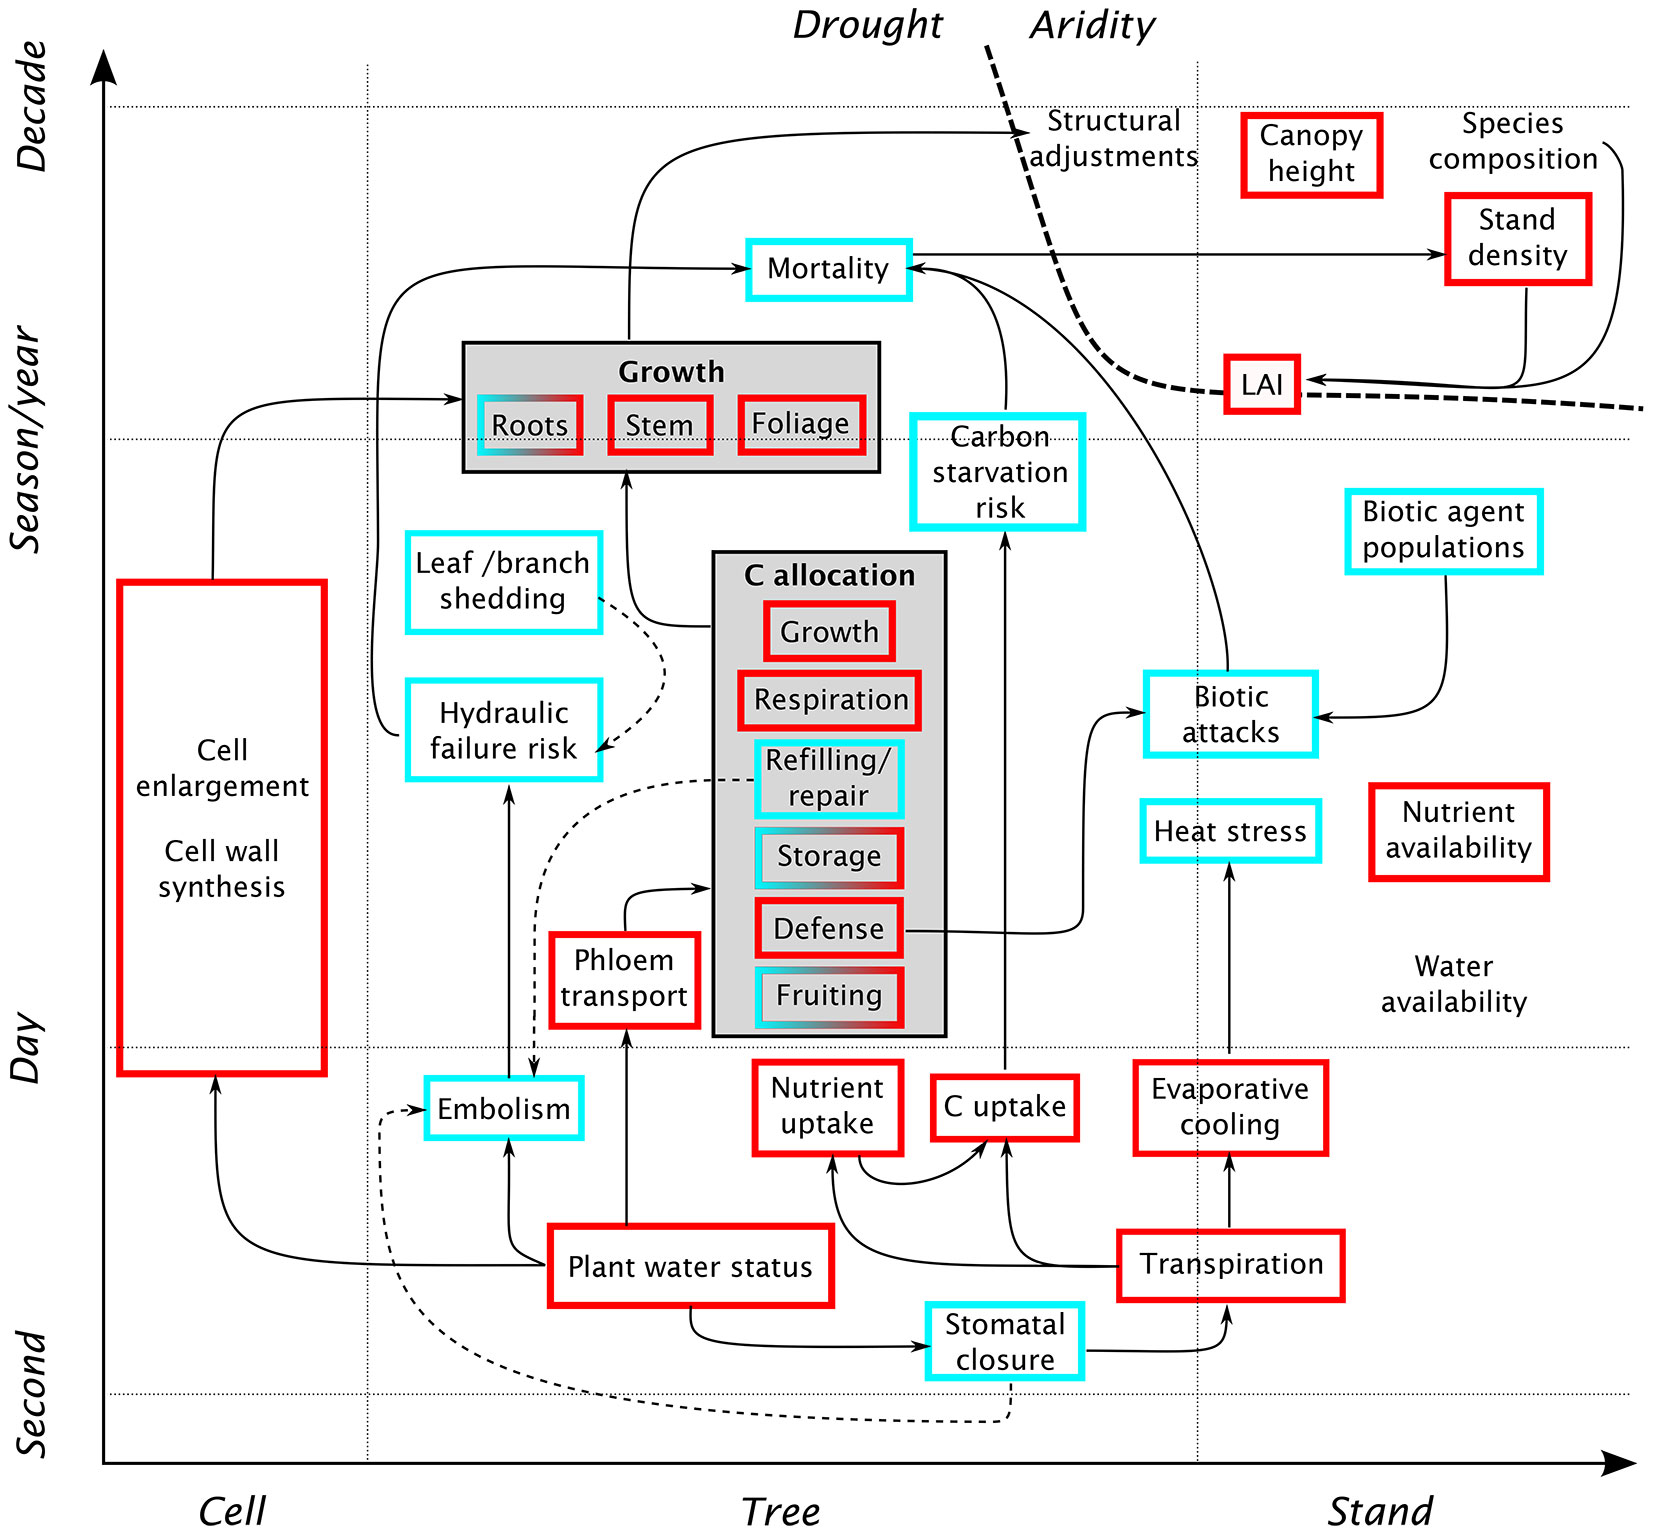
Much of the research on tree response to drought in the recent years has been motivated by increased observations of tree mortality, and the need to understand the processes leading to tree death ([1]). This has led to intensive study of the mechanisms discussed above (generally summarized under the labels “hydraulic failure” and “carbon starvation”) from the perspective of tree mortality. However, these processes will not always result in immediate tree death. As long-lived organisms, trees have greater carbohydrate reserves than short-lived plants, allowing them to bridge a period of reduced carbon uptake. On the other hand, trees are susceptible to carry-over effects, where a drought may impact tree vitality in the subsequent years ([9]). These delayed effects are not only due to fluctuations in the carbohydrate storage, but also reflect the damage suffered by leaves and buds, and by the hydraulic system, during drought and heat stress. In any case, such effects contribute to weaken the tree, and make it more susceptible to other stresses, including new droughts ([9]). In the longer term, a tree may adjust to dry conditions via a number of structural adjustments, such as an increase in root biomass, a decrease in leaf area, and an adjustment of allometric relationships ([49]).
Besides the reduction of carbon assimilation, the transpiration reduction associated with stomatal closure may lead to a decrease in nutrient uptake as well as an increase in heat stress. The former is due to the fact that nutrients are generally absorbed from the soil by plant roots, and may be further exacerbated by the lower availability of nutrients in a form that can be used by the plant in dry soils ([65]). Nutrient deprivation interacts with the effects of water deficit and often slows down growth and modifies allocation patterns ([15]). Heat stress, amplified by the lack of evaporative cooling due to transpiration reduction, increases maintenance respiration and may cause damage to plant tissue, especially leaves ([9]).
Another factor interacting with drought stress is the effect of biotic agents, such as insects and pathogens. Reduced carbon availability lowers the ability of a tree to defend itself against biotic attacks, e.g., through the production of certain compounds. In these cases, a biotic attack may be the ultimate cause of mortality of a tree already weakened by drought. Furthermore, an outbreak occurring on a weak tree may increase the population of biotic agents to a size where they become threatening even to neighboring healthy individuals ([51]).
The effects of drought at the scale of forest stands are much less documented than for individual trees ([16]). Due to competitive interactions, it cannot simply be assumed that stand-level drought response is the sum of all individual responses. As favorable site and climate conditions increase competition, they can actually promote mortality ([16]). It has often been observed that, with all other factors constant, water stress decreases with decreasing stand density ([26]), which is why stand thinning is used as a management strategy to prevent drought stress ([2]). Another factor of stand-scale response is the differential susceptibility of trees of different sizes to drought effects. Generally, seedlings and the tallest trees are the most at risk, the former because of their smaller rooting system and the latter due to the longer hydraulic pathways, increasing the risk of hydraulic failure ([50]). Stand-level drought response is further complicated by the changing light availability following mortality, which influences regeneration ([16]). Over longer time scales, stand-level indicators of dry conditions include stand structure and composition, with more drought-resistant species or genotypes being favored ([13]), low stand density ([16]) and a limitation of maximum tree height ([69]).
A classification of drought and aridity indices
Fig. 2 shows a classification of the indices described in this section (the full names of all indices shown in Fig. 2 are given in Tab. 1). The levels of the pyramid indicate the various processes considered by each index - the higher up, the more processes are included. A common feature that almost all indices take into account is precipitation (or its variability). The first level contains the indices based on precipitation only. The second class of indices combines precipitation with information on evaporative demand, or a proxy such as temperature. In the next class, soil moisture storage is introduced, thus allowing the index to consider antecedent conditions. The next class further includes the effect of stand characteristics, such as leaf area or rooting depth. Finally, the last class considers species-specific physiological properties, such as thresholds of plant-internal water status corresponding to harmful conditions. The pyramid is further divided between indices of drought and of aridity. The latter describe long-term, climatic conditions, whereas the former describe short-term disturbances. Any index of aridity can also be used to characterize drought, by applying it to shorter time scales and analyzing its temporal variation. The reverse is not true, especially in the case of standardized indices such as SPI or SPEI (see next chapter), which express drought in terms of a departure from long-term conditions.
Fig. 2 - Classification of the indices discussed in this review. The levels of the pyramid indicates the levels of information accounted for by an index. Indices at the bottom only consider precipitation (absolute values or anomalies), whereas indices on other levels also account for evaporative demand, soil moisture storage, and variations in vegetation properties. Indices at the top also take into account physiological properties of plants, so that they are expected to relate most directly to the processes described in section “Drought and aridity effects on trees and forests”. Depending on the data and models used, an index can belong to different pyramid levels. Indices on the left side can only be used to quantify drought (i.e., anomalously dry conditions), whereas those on the right side can also describe aridity (i.e., long-term water scarcity).
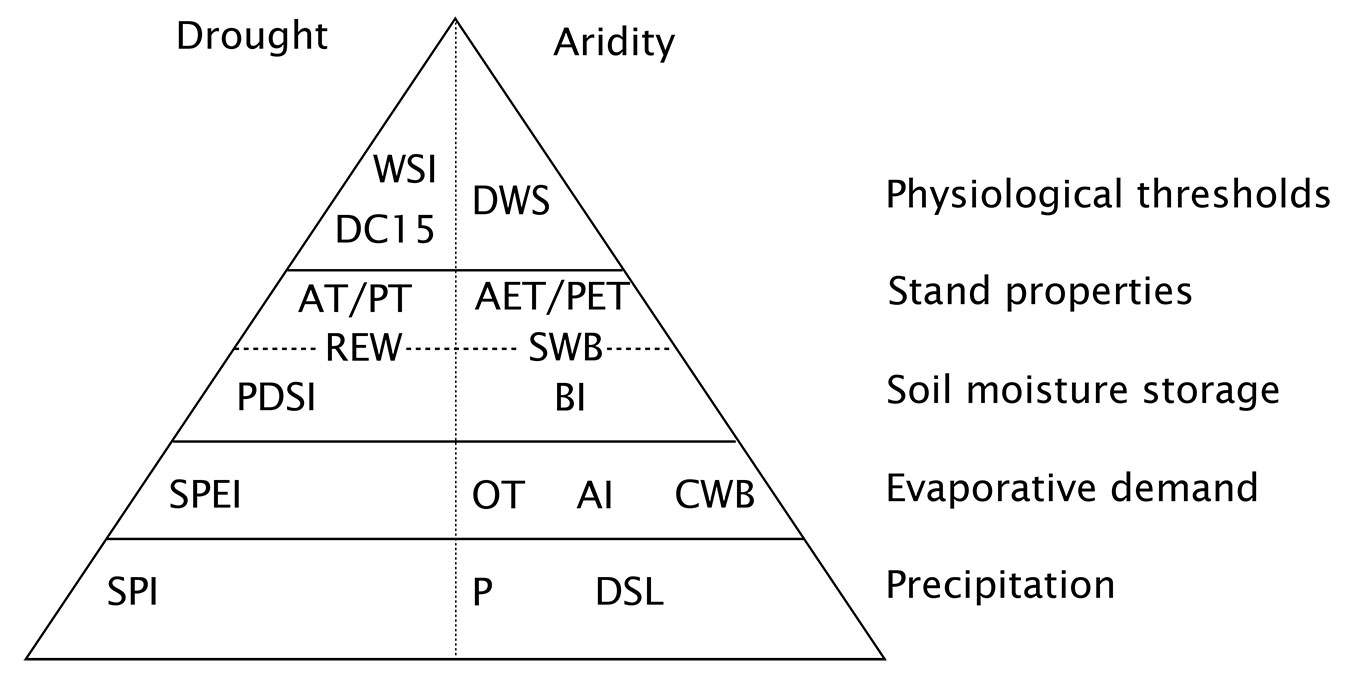
Tab. 1 - Abbreviations and full name of the indices shown in Fig. 1.
| Abbreviation | Description |
|---|---|
| SPI | Standardized Precipitation Index |
| P | Precipitation |
| DSL | Dry spell length |
| SPEI | Standardized Precipitation Evapotranspiration Index |
| OT | Ombrothermic indices |
| AI | Aridity index of Budyko ([11]) |
| CWB | Climatic water balance |
| PDSI | Palmer Drought Severity Index |
| BI | Bioclimatic intensity |
| REW | (Indices based on) Relative extractable water |
| SWB | Site water balance |
| AT/PT | Ratio of actual to potential transpiration |
| AET/PET | Ratio of actual to potential evapotranspiration |
| DC15 | Drought stress index of De Cáceres et al. ([20]) |
| DWS | Dynamic water stress of Porporato et al. ([65]) |
| WSI | Water stress integral |
Precipitation-based indices
Perhaps the most straightforward index of water supply is an absolute value of precipitation over a season or year, represented by P in Fig. 2. P is sometimes used to quantify annual water supply in dendrochronological studies, or as a rough climatic index (e.g., along with mean temperature) in site description. This approach overlooks the fact that vegetation water supply does not only depend on precipitation sum, but also on intermittency and intensity of rainfall events ([65]). A possible way to quantify rainfall intermittency is to calculate the maximum dry spell length (DSL), i.e., the number of days without rainfall. Gu et al. ([35]) developed two indices of rainfall intermittency and variability, and found strong relationships with annually integrated measurements of predawn leaf water potential. Furthermore, these indices were well correlated with cumulative sums of temperature and vapor pressure deficit (VPD), suggesting that these indices also implicitly represented the effects of high evaporative demand. If the aim is to compare drought events across different locations, P is not a suitable index, as the same absolute value may indicate water deficit at one location and surplus at another. It is therefore more informative to quantify to what extent rainfall in a given period deviates from long-term conditions. This has led to the development of the Standardized Precipitation Index SPI ([52]). The SPI can be calculated at various time scales (typically between 1 and 24 months). These scales represent the window over which precipitation values are aggregated (i.e., summed). For example, for a 3-month time scale, aggregated precipitation in June of a given year is the sum of precipitation in April, May and June. Next, a probability density function is fitted over all monthly aggregated values, which are then standardized. The SPI in a given month is the number of standard deviations from the mean, with negative values indicating dry anomalies, and positive values wet anomalies. The multiscalar nature of SPI (i.e., the possibility to apply different aggregation time scales) is seen as a strong advantage of this index, as different systems (e.g., soil moisture, groundwater, vegetation) react to drought at different time scales ([88]).
Inclusion of evaporative demand
As noted in the introduction, drought depends not only on water supply, but also on evaporative demand, which is not considered by the indices presented so far. This may become especially problematic under a changing climate, where evaporative demand is expected to increase. A wide range of empirical indices relating precipitation to temperature have been proposed (see [72] for a recent application). Some of these indices are based on climate diagrams, such as the Bagnouls-Gaussen aridity index ([4]), so that they can be expressed either numerically or graphically. In Fig. 2, these ombrothermic indices are collectively labeled OT. Some indices often used in forest-related studies are de Martonne’s aridity index ([21]) or the Forestry Aridity Index ([28]). They have been used to quantify interannual variations in water supply ([7]), examine aridification trends ([66]) and predict future species distribution limits ([72]). Despite their simplicity and the fact that they are based on climate only, these indices show a strong association with tree physiological quantities, such as hydraulic traits ([90]).
While these ombrothermic indices take temperature as a proxy for evaporative demand, others need the estimation of potential evapotranspiration (PET), such as the aridity index AI = PET/P ([11]), or the climatic water balance CWB = P-PET ([8]). The term “potential evaporation” is ambiguous, as there exist many different formulations to calculate it, with sometimes conflicting definitions. One especially important point is that some methods calculate PET as a purely meteorological quantity, whereas others account for the effect of surface properties ([78]). The implications of such differences are discussed below. It is also worth noting that the term “evapotranspiration” is subject to criticism in hydrology ([73]), as it combines several independent processes. In this review, this term will still be used, to reflect the fact that some water balance models do not calculate transpiration and soil evaporation separately. By contrast, the term “transpiration” will be used where canopy transpiration is calculated on its own. Vicente-Serrano et al. ([87]) have proposed the Standardized Precipitation Evapotranspiration Index SPEI, which is analogous to SPI, but based on monthly CWB instead of precipitation. The SPEI combines the advantages of the SPI, i.e., its multiscalar nature and ease of calculation, with the inclusion of evaporative demand, which makes it more suitable for applications under climate change.
Inclusion of soil moisture storage
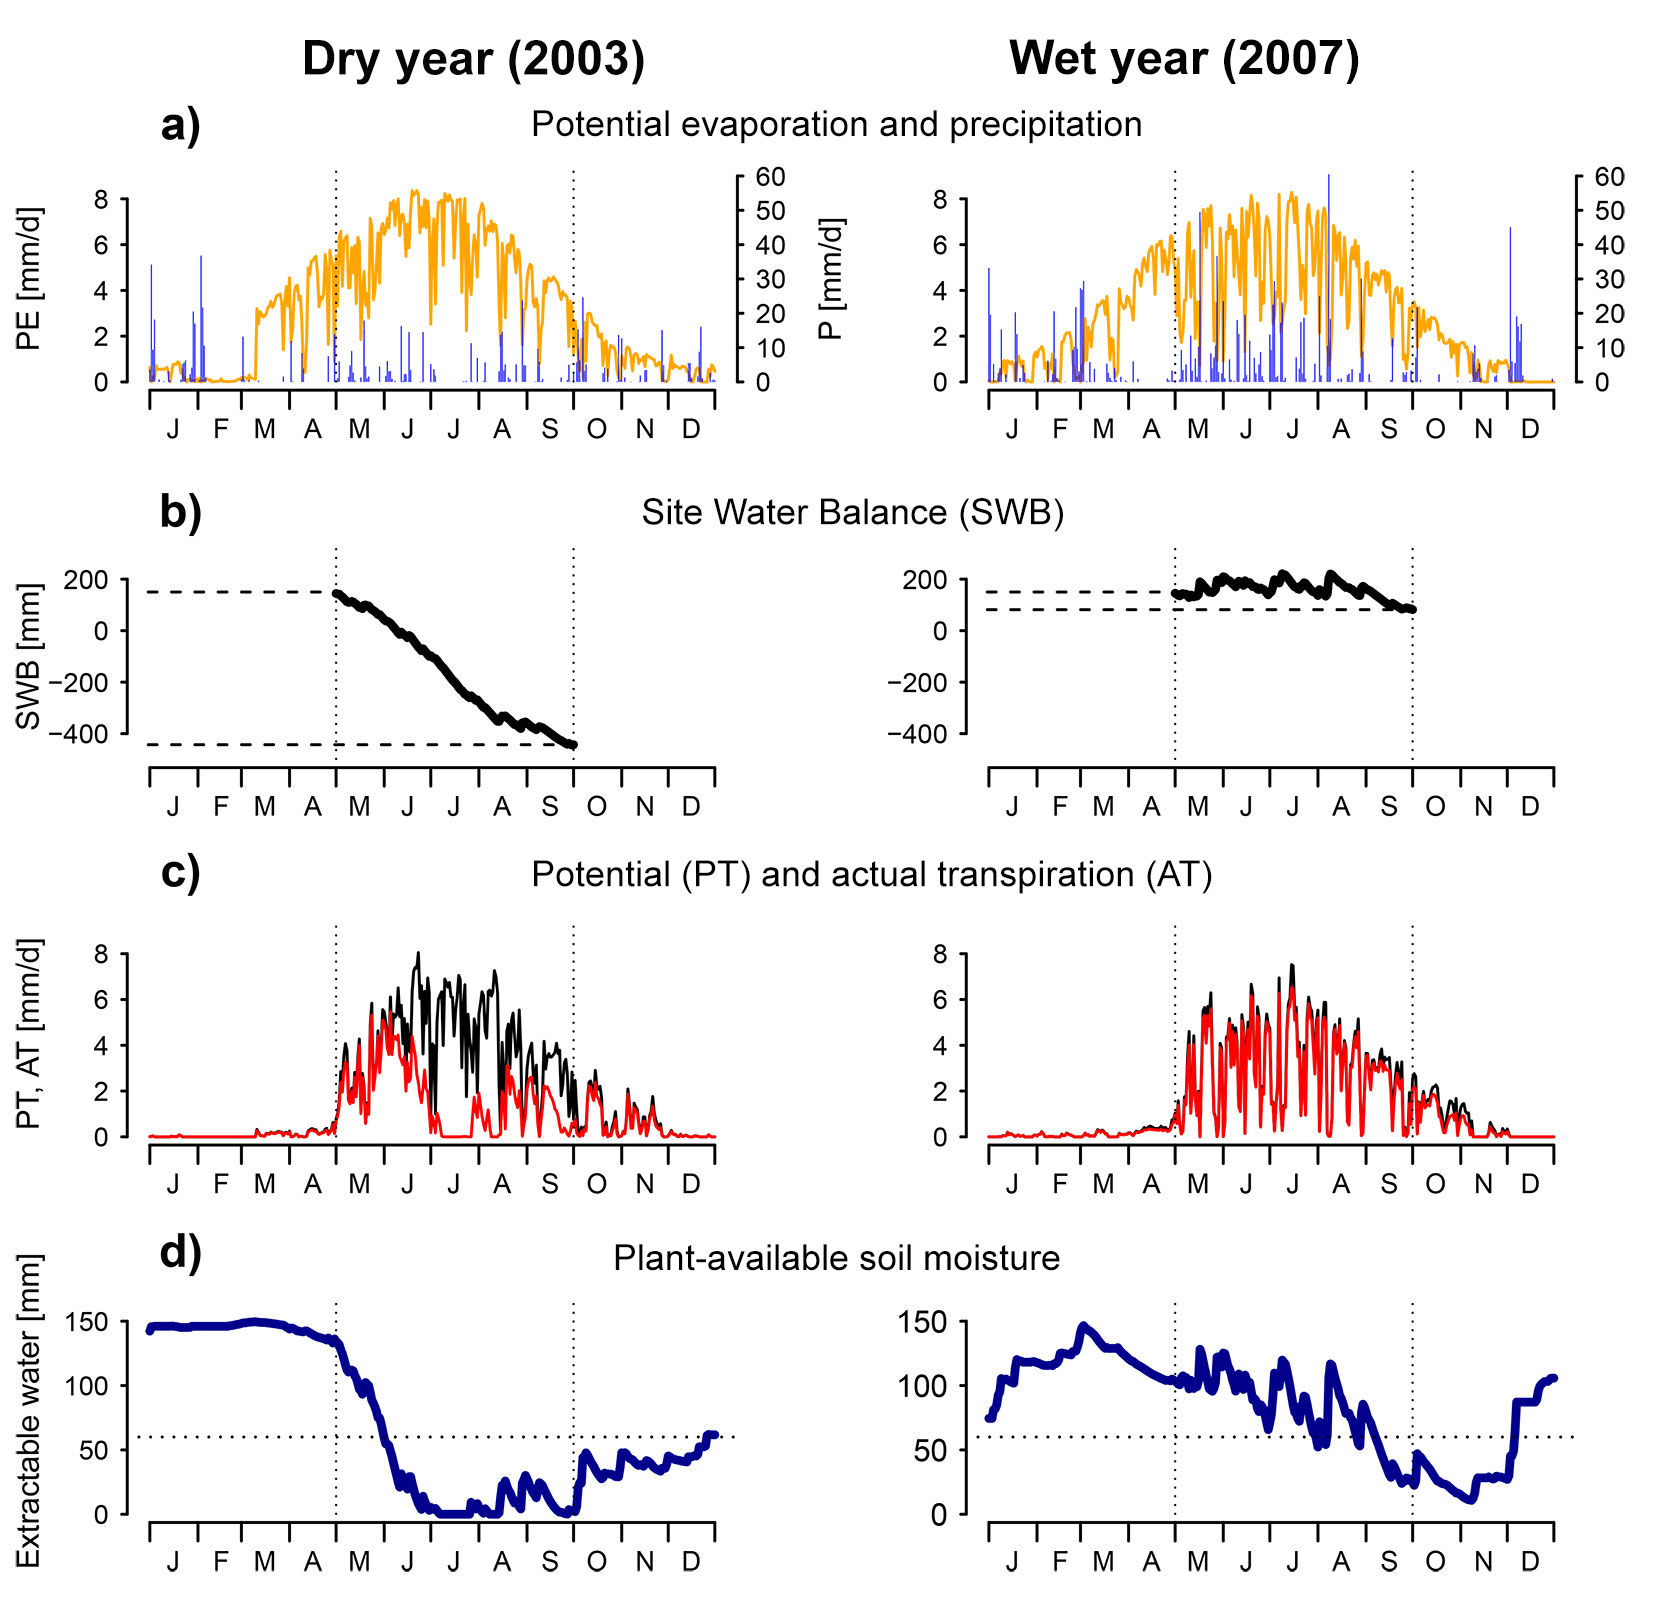
While the interaction of water supply and demand is a primary determinant of vegetation water availability, the rooting zone provides a buffer in which water can be stored, allowing the vegetation to bridge a dry period. Water availability indices that consider this storage have a certain “memory”, i.e., they consider conditions prior to the period for which the index applies. The Site Water Balance (SWB) is the sum of CWB and rooting zone storage capacity (expressed in mm). This formulation applies to climates where soil moisture is recharged outside of the growing season, as is usually the case in temperate climates. This variable has long been used in forest-related research. For example, Grier & Running ([33]) found a strong correlation between SWB and leaf area across multiple stands. An example calculation of SWB is given in Fig. 3 for two sample years (the dry year 2003 and the humid year 2007) at the meteorological station Montana, Switzerland. The daily sums of precipitation and potential evaporation (calculated following [67]) are shown in Fig. 3a, whereas Fig. 3b shows daily cumulative sum of precipitation minus PET, starting from the rooting zone storage capacity (set to 150 mm in this example). The SWB is evaluated at the end of the growing season. In this example, SWB is approximately -450 mm for the dry year and 100 mm for the wet year.
Fig. 3 - Example calculations for various drought indices, based on data from the meteorological station Montana (Switzerland). These examples show an abnormally dry year (2003, left side) and an abnormally wet year (2007, right side) at that station. Vertical dotted lines indicate the end of April and the end of August, which approximately correspond to the start and end of the growing season. (a) Daily values of potential evaporation (calculated following [67]) and precipitation. (b) Cumulative sum of site water balance SWB. The difference between the value at the end and at the start of the growing season can be taken as a seasonal drought index. (c) Daily potential and actual transpiration, as simulated with the water balance model FORHYTM ([81]). Surface and soil properties are identical for both years. Transpiration is lower than the potential rate if stomata close due to low soil moisture or high VPD. (d) Plant available soil moisture, from the same simulation. Rooting zone storage capacity was set to 150 mm. The horizontal dotted line corresponds to 40% of storage capacity, the critical threshold for stomatal regulation.
Other approaches explicitly model local water balance to include the effect of soil moisture storage. Indices are then calculated based on the outputs of these models, i.e., potential and actual evapotranspiration (AET) and soil moisture state. The models used to this effect differ greatly in complexity, temporal resolution and data requirements. A popular, parsimonious water balance model ([12]) operates at a monthly time step and uses the empirical, temperature-based formulation of Thornthwaite ([83]) to estimate PET. More complex models ([32], [93]) operate at a finer (daily or sub-daily) time scales, use more physically-based methods to estimate evaporative demand and resolve water partitioning in a more mechanistic way. An important, but sometimes overlooked difference exists between these two types of models: models like that by Bugmann & Cramer ([12]) are independent of surface properties and simulate the water balance for an implicitly defined reference crop ([80]). The “AET” simulated by these models is therefore not necessarily representative of the quantity of water transpired by the prevailing vegetation at a given location. Indices based on such models are representative of abiotic site conditions, independently of the current vegetation cover ([24]). By contrast, where surface parameters may be adjusted to reflect differences in vegetation properties ([93]), drought indices might differ between sites with a similar climate but different vegetation. An even more explicit way to consider surface properties in drought indices is discussed in the chapter “Inclusion of vegetation properties”.
Soil moisture
One widely used variable to indicate water availability is the simulated soil moisture. Several different statistics have been used to condense time series of soil moisture simulations into a single scalar. These indices are indicated as REW in Fig. 2. As shown by their position on the pyramid, they can be calculated with surface-dependent or surface-independent models. Simulated soil moisture is most commonly expressed as soil water potential ψs [MPa], or as a fraction of total plant-available water (Relative Extractable Water, REW). The estimation of plant-available water requires at least three parameters: water content at field capacity FC and at the wilting point WP, as well as the depth of the soil or of the rooting zone. These parameters depend strongly on soil properties. Extractable water is defined as the difference of FC and WP, multiplied with soil or rooting depth. An important threshold is the relative extractable water at which stomatal closure is induced. This threshold is often set at 40% of extractable water, based on a literature review by Granier et al. ([32]). In recent applications, soil moisture-based indices have mostly been used to assess the spatial variability of effects of meteorological droughts ([29]), examine the temporal or spatio-temporal variability of water availability ([41]) or to characterize site conditions ([64], [75]). Regarding the last application, Schwärzel et al. ([75]) pointed out the higher importance of extreme events relative to long-term averages. Fig. 3d gives an example of simulated soil moisture for the case described above. The simulation was done with the water balance model FORHYTM ([81]). Possible soil moisture-based drought indices are the number of days where soil moisture was below critical level (indicated by the horizontal dotted line), or an integral of the curve below the critical level.
The AET/PET ratio
Another popular index is the ratio of actual to potential evapotranspiration, AET/ PET, where AET may take either of the definitions discussed above. If soil moisture is the only factor reducing ET from its potential rate, such an index is very similar to the soil moisture-based indices discussed in the previous paragraph. Indices of this form are widely used in agriculture, due to a close empirical relationship with crop yield ([23]). Specht ([79]) proposed a model to simulate growth of perennial plant communities based on monthly AET/PET and canopy properties. Reed & Waring ([70]) developed and parameterized a model to simulate daily actual and potential transpiration, where potential transpiration was calculated using the lowest measured stomatal resistance. They calculated the actual to potential transpiration ratio using meteorological data from 14 forest sites. In conjunction with a temperature index, they successfully applied a regression to predict maximum tree height at each site. Since then, annual AET/PET or functionally similar indices have been implemented in many dynamic vegetation models ([12]). Used in this way, AET/PET serves to quantify both long-term moisture supply and demand ratio as well as inter-annual fluctuations. Besides dynamic modeling, AET/PET has also been used to model the distribution of tree species ([43]), with lower limits typically around 0.6 for temperate European species. In all these applications, water availability is one of several environmental factors relevant for tree growth and survival, typically in conjunction with cumulative growing-season temperature and winter chill. Although early developments were based on upscaling tree transpiration ([79], [70]), the routines estimating AET/ PET in the aforementioned cases generally group transpiration together with soil evaporation, and use an (implicit) reference vegetation cover to calculate AET. The reasons for this lie partly in the modest data and computational demands of such models, and partly in the need to define a truly abiotic index ([24]). From a hydroclimatological point of view, the ratio of long-term actual to potential evapotranspiration, termed evaporation efficiency ([98]), serves to quantify energy partitioning. It can be estimated using one of the various functionally similar equations of the Budyko framework ([11]), relating evapotranspiration to the aridity index AI = PET/P. In the equation of Budyko ([11]), long-term water and energy partitioning depends on precipitation and PET sums only. However, surface properties also affect long-term evapotranspiration ([98]).
The Palmer Drought Severity Index (PDSI)
The Palmer Drought Severity Index PDSI ([61]) was one of the first indices to account for evaporative demand and antecedent soil moisture conditions, and is still widely used for drought analysis and monitoring ([39]). As its calculation is rather complex and has been described in great detail elsewhere ([39], [61]), the procedure is only briefly outlined here. The required inputs are weekly or monthly time series of precipitation and temperature. At the core of the PDSI is a water balance accounting scheme using a two-component soil. At each time step, incoming precipitation is added and evapotranspiration (ET) is subtracted from the reservoirs. Based on these calculations, a “CAFEC” (Climatically Appropriate For Existing Conditions) precipitation value is defined for each time step. The difference d [mm/month] between actual and CAFEC precipitation for a given month represents the departure from normal water supply. To ensure comparability across different months and locations, Palmer defined an empirical weighting factor Kj for each month j of the year. The product of d and Kj, termed Z, represents moisture anomaly relative to long-term climatology. It is sometimes used as a drought index as well. Palmer uses empirical relationships to translate Z into the PDSI, an index of drought (or wet spell) severity, with values typically ranging between -4 (extreme drought) and 4 (extreme wet spell). The PDSI is an accumulating index ([96]), meaning that the value in each month depends on the value in the preceding months. The PDSI algorithm contains some empirical constants, which were estimated by Palmer based on data from only two locations. These values are not necessarily transferable to other locations, which hinders spatial comparability of PDSI values. Therefore, Wells et al. ([96]) developed a self-calibrating version (scPDSI), which calculates these empirical factors based on the meteorological data at any location.
Bioclimatic intensity
The Bioclimatic Intensity (BI) method was originally proposed by Montero De Burgos & González Rebollar ([57]). This method has mainly been used for characterizing site conditions for vegetation composition and productivity in Mediterranean climates ([30], [49], [17]). The BI indices express the cumulated sum of monthly temperatures above a threshold of 7.5 °C, for periods where vegetation activity is assumed to be unconstrained (free BI), limited (constrained BI) and halted (dry BI) by water shortage. This method uses a simple water balance model, similar to the one of Bugmann & Cramer ([12]).
The free BI was used by Condés & Garcìa-Robredo ([17]) as a predictor of stand growth across sites, along with other bioclimatic indices. While the free BI increases with higher temperatures as well as with greater water availability, it can be seen as a measure of aridity when comparing sites with a similar annual temperature profile. López-Serrano et al. ([49]) used free and constrained BI to construct site-specific allometric relationships. They used two versions of the BI indices, short-term (in the last two years before data collection) long-term (over a period of 60 years). García-Salmerón ([30]) gives species-specific thresholds for dry UBC, which facilitates the choice of species for afforestation. Furthermore, BI indices can give an estimation of expected wood production of different species at a given site ([30]).
Inclusion of vegetation properties
Some water balance models explicitly partition evapotranspiration into transpiration, interception loss and soil evaporation ([38], [76], [99]). As these models can be parameterized with properties of the actual vegetation cover, rather than a reference cover, they enable a realistic simulation of a site’s water balance, including soil moisture dynamics. These indices can be used to compare the effect of meteorological drought at sites with similar meteorological conditions but different vegetation cover ([91]).
The AT/PT ratio
This index is similar to AET/PET, but expresses the ratio of actual to potential transpiration rather than evapotranspiration. Therefore, it is more directly representative of the conditions experienced by the canopy. The effect of soil evaporation or understory transpiration is only indirect, through soil moisture depletion. Although it strongly depends on local meteorological conditions ([99]), AT/PT is sensitive to surface properties such as leaf area index (LAI), canopy conductance and soil properties ([81]). It was shown to be correlated with tree-ring width ([38]) and crown condition ([99]). An example of this index is shown on Fig. 3c. Daily potential and actual transpiration values were obtained from the same simulation as for soil moisture. Transpiration is reduced below potential rate through the effect of low soil moisture and high vapor pressure deficit on stomatal conductance. This index has been implemented in coupled, dynamic models of water balance and forest dynamics ([48], [76]). As AT/PT considers the effect of surface properties, these models include a negative feedback between stand development and water availability, through the effect of LAI ([48]). This is consistent with observations and the theory of an equilibrium between climate, soil and vegetation ([59]). In these models, AT/PT may be calculated for the whole canopy ([48]) or for groups of similar trees ([76]). Recently, empirical relationships have been implemented in a dynamic forest model using AET/PET to make evaporative supply and demand dependent on canopy LAI ([26]). While this does not constitute an explicit partitioning of evapotranspiration into its components, the resulting index is functionally similar to AT/PT. This process formulation has been used to define separate drought indices for trees, saplings and herbaceous understory ([84]).
Inclusion of physiological properties
The inclusion of vegetation properties represents a shift from a description of abiotic site conditions towards drought as it is experienced by the prevailing vegetation. Aside from this difference, an index such as AT/PT has essentially the same meaning as the corresponding abiotic index AET/PET. Both indices indicate a restriction in water consumption, which is assumed to be related to a decrease in vitality. Neither of these indices indicates to what extent the different physiological processes are affected by the water shortage. For a closer representation of the effect of drought on vegetation, some indices can be more directly linked to physiological processes. The indices discussed in this section form the uppermost compartment of the pyramid, with the highest level of detail. However, summarizing a complex phenomenon such as drought remains a vast simplification and is still associated with a considerable loss of information.
Plant water status
Leaf water potential (Ψl [MPa]) is a widely used indicator of instantaneous water stress. Water potential expresses the water content of plant organs, among others, and is defined as the difference in free energy per unit volume, compared to that of pure water under reference conditions ([65]). However, it was long unclear how short-term water stress episodes related to long-term growth and vitality. Myers ([58]) proposed a method to integrate Ψl over time and explored its relationship with two growth indicators, needle length and basal area increment, over four years. The new index, termed water stress integral (WSI), is expressed in MPa and consists of the sum of measured Ψl over a growing season, with each value weighted by the number of days since the last measurement. Myers ([58]) found that WSI was better correlated with both growth indicators than a cumulative soil moisture index. This indicated that the growth reductions due to water stress were not solely due to soil moisture deficits. Myers ([58]) further noted that even a mild plant-internal water deficit could have a great impact on needle length if it persisted over a longer period. Since then, WSI has been used in various studies ([68]). These studies revealed a strong relationship between WSI and productivity, allocation fractions and leaf area ([68]). The aforementioned studies were carried out on monospecific stands and do not provide a comparison across species. As species differ in their regulation of Ψl, the effect of WSI on growth and vitality are likely to vary across species.
De Cáceres et al. ([20]) developed a dynamic model for simulating drought stress in forest stands, on a tree cohort basis (shown as DC15 in Fig. 2). Daily drought stress of a cohort is defined as the one-complement of relative whole-plant conductance, which depends on soil water potential and a species-specific parameter indicating 50% loss of conductance. At the annual timescale, a cohort-level drought index is defined as the fraction of days with relative conductance less than 50%. This index was shown to be sensitive to variations in precipitation and leaf area, as well as root and soil properties. The model of De Cáceres et al. ([20]) was applied by Ameztegui et al. ([2]) to simulate the effect of thinning on physiological drought across a humidity gradient.
Probabilistic approaches
In this classification, a distinction was made between aridity indices, representing long-term water availability, and drought indices, representing a departure from normal conditions. Probabilistic approaches offer a third perspective, in which the probability of stress occurrence is calculated for given soil and climate characteristics. In statistical dynamic water balance models ([65]), precipitation events are described as a marked Poisson process with a certain frequency [days-1] and mean intensity [mm event-1]. Based on a probabilistic calculation of soil moisture dynamics, Porporato et al. ([65]) proposed a measure of water stress, termed “dynamic water stress”. Stressful conditions are assumed to occur when the soil moisture content drops below a critical level. Dynamic water stress (DWS) integrates the effect of water shortage intensity (value of soil moisture deficit), duration, and the frequency of water shortage episodes. The model requires abiotic inputs (precipitation characteristics, soil depth and water holding capacity) and plant properties (rooting depth and two empirical parameters describing sensitivity to water stress), as well as the specification of potential transpiration, which integrates evaporative demand and plant properties such as leaf area and stomatal conductance. The two sensitivity parameters describe the shape of the non-linear relationship between soil water deficit and plant water stress, and the maximum value of DWS that a plant can withstand. The dynamic water stress quantifies physiological drought, analogous to the other indices presented so far. It may be calculated for the prevailing vegetation at a site or for a hypothetical vegetation cover ([5]). This might be a useful way to assess the suitability of various tree species under projected future climates. However, this index has rarely been applied to temperate forests. A possible obstacle in its application is the difficulty to estimate the two species-specific drought sensitivity parameters. Parolari et al. ([62]) coupled the probabilistic soil moisture model of Porporato et al. ([65]) to a description of plant-internal water and carbon budget. Their study, however, does not rely on the specification of a drought index such as DWS.
Variations
The classification presented here outlines the methods to calculate different drought indices. However, there are many ways to extract a single number from time series of simulated transpiration or soil moisture. Indeed, different statistics can be used, different integration periods can be defined, and the simulations can be performed with different models, using divergent and sometimes contrasting process formulations.
Typically, drought indices give a single value for a defined period, e.g., on an annual basis. However, this value might be calculated over a shorter period, e.g., the growing season, or early summer, which is a critical period for growth for many temperate species. Also, as the effects of a dry year affect tree vitality in several subsequent years, a rolling mean over two or three years is sometimes used ([38], [76]). As discussed for the soil moisture and (evapo)transpiration-based indices, the choice of input data or model can also affect the properties of an index. As already mentioned, different definitions of potential evaporation exist, and some formulations take into account variations in surface properties, while others do not. Depending on which definition is used, the same index (e.g., SWB or AET/ PET) may or may not be suitable to examine or simulate the effects of varying vegetation properties on physiological drought. Also, different water balance models have different formulations for the movement of water along the soil-plant-atmosphere continuum. The implications of these differences for the properties of drought indices are discussed in the chapter “The role of VPD for physiological drought”. As the various parameters and thresholds used (e.g., the critical soil moisture threshold) often have generic and uncertain values, it can be worthwhile to calculate the same index with different parameter values.
Intercomparisons and evaluations of drought and aridity indices
This section reviews the studies known to the author where different water availability indices were compared with each other. In most cases, these indices were evaluated with regard to their association with one or several indicators of tree vigor or forest state, such as tree ring width, defoliation or species distribution, whereas a few studies simply compare the properties of different indices without a target variable. The reviewed studies compared indices of aridity (Tab. 2) and drought (Tab. 3).
Tab. 2 - Overview of studies where water availability indices were compared with regard to their value in predicting long-term forest properties.
| Study | Location | Target variable |
Indices | Method / Criteria |
Main conclusions |
|---|---|---|---|---|---|
| Leathwick & Whitehead ([46]) | New Zealand | Potential distribution of tree species | SMI, VPD | - | Including VPD as a predictor improved models of species distribution |
| Rickebusch et al. ([71]) | Europe | Potential natural distribution of tree and shrub species | P, CWB, REW | - | Replacing P and CWB with dynamically simulated REW greatly impacted habitat change predictions |
| Czúcz et al. ([19]) | Hungary | Distribution of Fagus sylvatica | EQ, FAI | Regression tree predicting species occurrence | EQ is an important predictor of F. sylvatica distribution; FAI has no effect |
| Piedallu et al. ([64]) | France | Distribution of 37 tree species |
P, CWB, SMI |
Generalized additive model (GAM) | Predictors including soil water storage usually perform better than purely climatic indices |
| Walthert et al. ([94]) | Switzerland | Canopy height | AT/PT (average and extreme), CWB | Correlation | Highest correlation of canopy height with average RTI; no significant correlation with CWB |
Tab. 3 - Overview of studies comparing drought indices on the inter-annual time scale. SMI stands for various soil moisture-based indices. All other symbols are defined in Fig. 2 and in the text.
| Study | Location | Target variable |
Indices | Method / Criteria | Main conclusions |
|---|---|---|---|---|---|
| Schwärzel et al. ([75]) | Germany | - | RTI, REW, CWB | - | Nonlinear and soil-dependent relationship of RTD or REW with CWB |
| Grigoryan et al. ([34]) | Germany | - | ψs, REW, ET deficit | - | Higher inter-annual variability of SWP and REW than ET deficit |
| Schulte-Bisping & Beese ([74]) | Germany | - | AT/PT, REW | - | Weak temporal ; AT/PT deemed more sensible |
| Vilhar ([91]) | Slovenia | - | RTI, REW, CWB | - | REW indicated greater differences in drought duration between forests and gaps than RTI |
| Zierl ([99]) | Switzerland | Crown condition | AT/PT-based indices | Correlation | Species-dependent significance of different indices |
| Kempes et al. ([44]) | SW USA | Tree-ring width | Precipitation, SPI, PDSI, OT | Regression | Importance of soil moisture memory in semi-arid regions |
| Condés & Garcìa-Robredo ([17]) | SE Spain | Stand volume increment | Precipitation, AI, OT | Multivariate regression | Indices combining P and T perform slightly better than indices based on P alone |
| Vicente-Serrano et al. ([88]) | Global | Tree-ring width | SPI, SPEI, scPDSI, z-Index |
Correlation | Flexible temporal scale is an advantage of SPI and SPEI |
| Hogg et al. ([41]) | Western Canada | Tree-ring width | CWB, REW | Correlation | Importance of deep soil water reserves |
| Braun et al. ([8]) | Switzerland | Basal area increment | AET/PET, AT/PT, REW, CWB | Multivariate regression | SWB difference August-April |
| Braun et al. ([8]) | Switzerland | Mortality | AET/PET, AT/PT, REW, SWB | Multivariate regression | SWB and AET/PE T performed equally well for beech; early AET/PET performed best for spruce |
| Wagner et al. ([93]) | Germany | Tree ring width | Precipitation, AET/PET, REW, CWB | Correlation | AET/PET had highest correlation; P and T the lowest |
| Von Wilpert et al. ([92]) | Germany | Tree ring width | AT/PT, REW, ψs, T deficit | Correlation and regression | Species-dependent effect |
| Gao et al. ([29]) | Finland | Identification of extreme years | SPI, SPEI, REW | Heuristic assessment of temporal and spatial patterns | REW better suited at wet sites or sites with shallow soils |
| Bhuyan et al. ([7]) | Europe | Tree-ring width | SPI, SPEI, scPDSI, OT | Correlation | Differential response to different indices and timescales across species and biomes |
| Cortini et al. ([18]) | NW North America | Survival probability | Precipitation, REW, OT indices | Regression | Differential response to drought across species |
Tab. 2 gives an overview of the studies where water availability indices were assessed with regard to their value in predicting long-term forest properties, such as species distribution or forest structure. Statistical methods to predict species habitats commonly include one or more predictor describing water availability ([40]). For example, Czúcz et al. ([19]) modeled the distribution of two species with contrasting drought tolerance, the more sensitive Fagus sylvatica and the more tolerant Quercus petraea. They used regression trees to relate species occurrence with environmental predictors. To represent water availability, two alternative ombrothermic indices were used, in addition to monthly temperature and precipitation: Ellenberg’s Quotient (EQ - [27]) and the Forestry Aridity Index (FAI - [28]). Where EQ was used, it was an important predictor for the distribution of F. sylvatica, whereas FAI never appeared in the splitting variables of the tree models. On the other hand, for Q. petraea, neither of these two indices contributed to improve the models. In another study analyzing the distribution of F. sylvatica, Salamon-Albert et al. ([72]) found a different ranking of ombrothermic indices. These examples suggest that it is difficult to assess the suitability of ombrothermic indices as proxies of physiological drought.
Piedallu et al. ([64]) assessed the value of including soil water balance in predicting the distribution of 37 European tree species. To this effect, they measured the improvement of species distribution predictions over a null model based on temperature indices only. The candidate indices for water availability included purely climatic indices (precipitation and CWB) as well as soil moisture indices (mean soil moisture content and soil moisture deficit). For most species, the soil moisture led to a greater improvement of the models than climatic indices.
The moisture indices traditionally used to predict species are abiotic and do not account for surface properties ([24]). Rickebusch et al. ([71]) replaced such abiotic indices (precipitation and CWB) with mean soil moisture simulated with a dynamic ecosystem model (LPJ-GUESS - [40]). In these simulations, vegetation dynamics were coupled to water availability, and simulated soil moisture reflected vegetation adaptations such as LAI reduction under drier conditions. As a result, projected habitat changes under future climates differed greatly compared to those obtained with abiotic moisture indices.
Leathwick & Whitehead ([46]) were able to improve a model of tree species distributions in New Zealand through the inclusion of Vapor Pressure Deficit (VPD) as a predictor, in addition to soil moisture. They explained this with the adverse effects of high VPD on stomatal conductance and carbon uptake, and the regional decoupling of soil and air dryness due to the frequent occurrence of dry winds.
Instead of species distribution, Walthert et al. ([94]) compared moisture indices with canopy height. The compared indices were CWB, as well as two statistics of AT/ PT, the long-term average and the 2% quantile (representative of extreme conditions). Average AT/PT showed the best correlation with canopy height, whereas CWB showed no correlation. Furthermore, there was a strong nonlinear association between average and extreme AT/PT. The authors concluded that extreme AT/PT provided a better differentiation between moist sites, and average AT/PT between dry sites.
Tab. 3 lists the studies where drought indices were compared with regard to their short-term (e.g., annual) behavior. Some of these studies simply compared the properties of several indices, whereas others involved a quantitative assessment of the value of indices in predicting environmental indicators of productivity or vigor, such as tree ring width or survival.
Schwärzel et al. ([75]) found a nonlinear relationship between climatic water balance and AT/PT. Transpiration is practically unlimited when CWB is positive (i.e., P > PET), but AT/PT decreases sharply as the CWB becomes negative. This relationship is further modulated by soil properties: AT/PT started decreasing at less negative CWB in a soil with lower water holding capacity. Another index was the number of days for which REW indicated drought stress. Its relationship with CWB also showed a clear effect of soil water holding capacity. Spatial patterns of AT/PT and REW were similar, suggesting that both indices behave similarly. By contrast, Schulte-Bisping & Beese ([74]) found only a weak temporal correlation of daily AT/PT and REW: transpiration was sometimes reduced even at high soil moisture content, or relatively high even when soil moisture content was below the critical level. The authors attribute this to transpiration limitations in case of high evaporative demand, and to the uneven distribution of roots and incoming precipitation in the soil profile. Differences between transpiration and soil moisture-based indices were also found by Grigoryan et al. ([34]) and Vilhar ([91]). It is worth noting that all these authors used water balance with a high level of detail, such as LWF-BROOK90 ([38]). These models explicitly simulate soil hydraulics and root water uptake. With simpler water balance models, where REW directly impacts transpiration ([32]), a closer similarity between these two types of indices is to be expected.
Tree ring width (TRW) is a widely used indicator of environmental influences on tree growth and vigor. Therefore, many of the studies assessing the ecological and physiological significance of different drought indices used TRW as reference. Some studies examined the temporal correlation of annual drought indices, whereas others used regression models, sometimes also including non-drought related predictors, to predict annual TRW. Dendrochronological studies have also been used to assess the resistance, recovery and resilience of forests after drought events ([14]). Other studies used stand-level indicators derived from forest monitoring, such as crown condition, volume increment or mortality, as reference.
Studies comparing SPI and SPEI found a strong correlation between both indices ([14], [29]) and similar correlation coefficients with TRW for both indices ([88], [7]). By examining the temporal trends in the difference between SPI and SPEI, Cavin et al. ([14]) found that the contribution of evaporative demand to drought increased as temperatures rose over a period of 92 years. Vicente-Serrano et al. ([88]) report a higher percentage of sites for which SPEI had the highest correlation than for SPI. Also, Gao et al. ([29]) obtained a higher correlation with a soil moisture-based index for SPEI than SPI. This suggests that considering temperature in addition to precipitation adds value to drought assessments, even under present conditions. This has been corroborated by Condés & Garcìa-Robredo ([17]), who applied multivariate regression models to predict stem growth at inventory plots. They found that ombrothermic indices gave the best results compared to indices considering only precipitation or only temperature (although some OT indices did not outperform absolute precipitation).
The good performance of SPI and SPEI was attributed by Vicente-Serrano et al. ([88]) to their flexibility regarding time scales. Indeed, for each site, they reported the best correlation of SPI and SPEI calculated at time scales of 1 to 48 months. Also, Vicente-Serrano et al. ([89]) reported that the scale for which SPI and SPEI gave the best correlations with TRW varied across biomes. Typically, stands in arid climates, which are adapted to withstand periods of water shortage, respond to drought at longer time scales only, whereas stands in mesic climates already respond to drought at shorter time scales. On the other hand, in humid climates, a short-term deviation from average conditions might not substantially affect ecosystem processes, and only longer droughts might have a noticeable effect. As shown by Bhuyan et al. ([7]), this is further modulated by species identity. The effect of time scales can be linked to soil moisture dynamics and the associated memory. For example, scPDSI, which accounts for soil moisture storage, has been shown to behave in a similar manner as SPI and SPEI at time scales of up to 12 months ([7]). However, in the intercomparison of Vicente-Serrano et al. ([88]), the performance of scPDSI and similar indices was much worse than that of SPI and SPEI. By contrast, Gao et al. ([29]) obtained more plausible spatial patterns with REW than with SPEI, especially at wet sites or on shallow soils. Also Kempes et al. ([44]) and Hogg et al. ([41]) highlight the improvement of correlation when soil moisture is explicitly accounted for. The soil moisture-based index of Hogg et al. ([41]) was also used by Cortini et al. ([18]) to predict mortality, and outperformed climatic indices.
Wagner et al. ([93]) fitted regression models to predict TRW anomalies. The selected models combined several annual or seasonal drought indices. Although the models only accounted for 25 to 30% of the variance in TRW anomalies, the predictors all showed a high or very high level of significance. Cumulative soil moisture deficit and the number of days with critical REW (both relating to the previous year) were not as significant as the other predictors. The authors attribute this to the threshold property of these indices, which makes them suitable to indicate extreme droughts only. In a study comparing five tree species, Von Wilpert et al. ([92]) examined the correlation of various indices with TRW. The correlation coefficient and significance level varied greatly across species. However, the correlation coefficient for any index-species pair never exceeded 0.2. For four out of five species, the index that showed the best correlation with TRW was cumulative soil water potential deficit, based on a threshold of -1.2 MPa. Subsequently, the authors fitted regression trees to predict TRW from soil drought indices and meteorological variables. Also there, the effect of various indices differed across species. The differential sensitivity of species was also shown by Zierl ([99]), who compared various transpiration-related indices with observations of crown defoliation. Braun et al. ([8]) assessed the value of drought indices in predicting growth and mortality. For growth, site water balance performed best, whereas for mortality AET/PET was best suited.
Water availability indices in dynamic forest models
Tab. 4 shows various examples of drought indices being used in dynamic forest models. This list is not comprehensive, but provides an overview of different phenomenological approaches to model the effects of drought on growth and mortality. In all of these models, water availability interacts with other environmental factors, such as light, cumulative growing-season temperature or winter chill. Often, the mean or minimum (i.e., the most severe stress) of the different stress functions is used. The interaction with other stress factors is not discussed further here.
Tab. 4 - Examples of drought indices and their use in dynamic forest models.
| Model | Indices | Growth | Mortality | Other drought impacts |
|---|---|---|---|---|
| FORCLIM ([12]) |
AET/PET | Square-root function | Empirical function of growth | Maximum height ([69]) |
| FORECAST-Climate ([76]) |
AT/PT | Reduction of base growth rate | Nonlinear function of 2-year AT/PT | - |
| 3PG ([45]) |
Monthly REW and VPD | Carbon uptake and allocation | Stem number-biomass allometry | - |
| Iland ([77]) |
Similar to 3PG | Similar to 3PG | Function of C budget | Bark beetle infestation; Establishment |
| DSS-WuK ([82]) |
CWB, AET/PET, Ψsoil | Function of site index | Function of extreme drought length (Ψsoil) | Bark beetle infestation; Site index |
| LANDIS drought extension ([36]) |
PDSI | - | Statistical relationship between drought length and mortality | - |
The annual or seasonal AET/PET is a widely used water availability index in dynamic forest models, illustrated here by FORCLIM ([12]). The effect of drought on annual growth is usually represented with a nonlinear function, with slowly increasing effects at moderate levels of drought, and rapidly increasing effects at more extreme levels. This is based on various observations of radial growth ([6]) and canopy height ([70]), where higher levels of drought or aridity had a disproportionately large effect (see also [65], for a discussion of nonlinearity in plant drought response). FORCLIM uses a square root function, in which a species-specific parameter indicates the level of AET/PET at which annual radial growth is minimal. Fig. 4a illustrates this function for two species with differing sensitivity. As can be seen, the same level of AET/PET (e.g., 0.8) translates into a severe growth reduction for a more sensitive species (e.g., Fagus sylvatica), but barely impacts growth of a more drought-tolerant species (e.g., Pinus sylvestris). The implementation of such growth reduction functions varies across models.
Fig. 4 - Example of two functions translating drought indices into modifiers of tree vitality or mortality in dynamic forest models. (a) Square-root function of AET/PET, calculating a drought-dependent vitality function. This function is commonly applied as a multiplier of a potential growth term in dynamic models, often in conjunction with other environmental factors. This function contains a species-specific drought tolerance parameter, corresponding to the AET/PET value where the function reaches zero. In this example, the solid line corresponds to a species with a higher drought tolerance than the dashed line. Therefore, the same AET/PET value (e.g., 0.8) has very different effects on these two species. (b) Weibull function relating a soil moisture index (number of days below a critical soil water potential threshold) to the probability of survival in a given year.
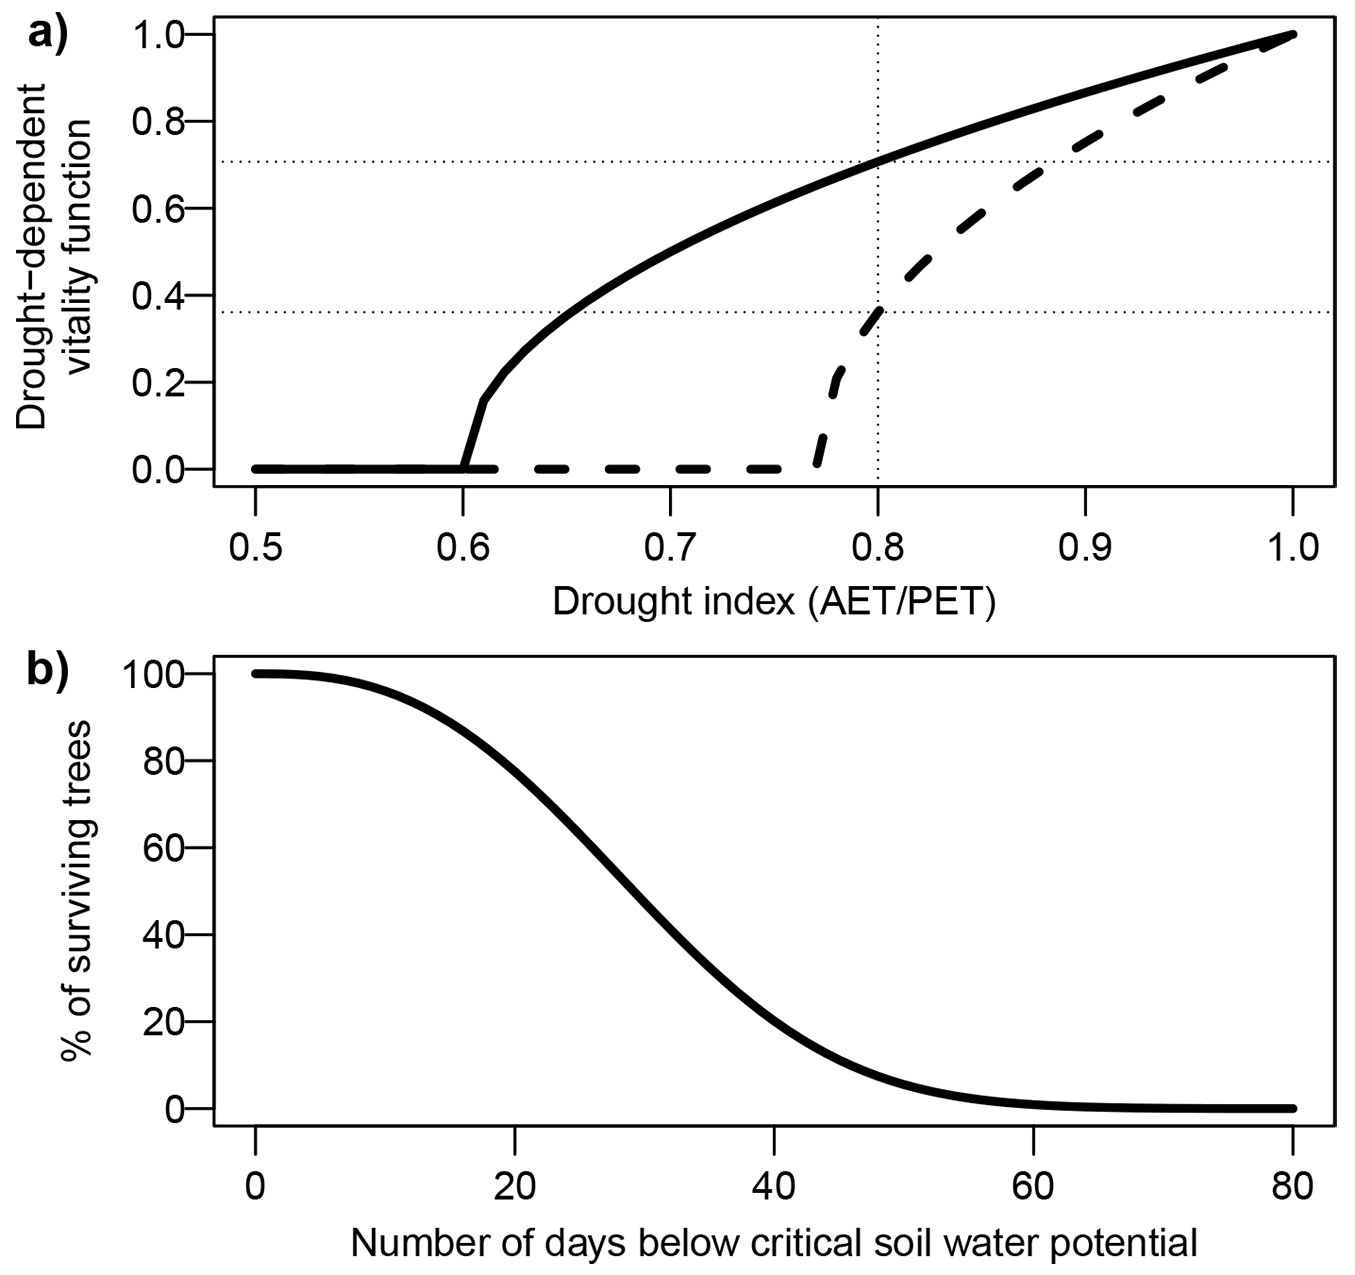
For example, in FORECAST-Climate ([76]), the annual AT/PT index is calculated at the level of groups of similar trees, taking directly into account species-specific drought sensitivity. While growth and mortality are the only aspects affected by drought in most models, other effects can also be represented. For example, Rasche et al. ([69]) linked AET/PET to maximum tree height, in addition to radial growth. Other models ([77], [82]) include a module simulating bark beetle population dynamics and the associated damage to trees, where AET/PET influences the vulnerability of trees.
Other mainly phenomenological forest dynamics models use somewhat more mechanistic approaches, while still relying on scalar indices to quantify drought. For example, 3-PG ([45]) simulates carbon allocation based on monthly environmental indices, among which a soil moisture index and atmospheric VPD. An empirical stress index is calculated for both of these quantities, and the more severe of the two is taken to represent water availability constraints. Thus, drought and other environmental modifiers not only limit growth, but modify the structure of the canopy, with more resources being allocated to roots under unfavorable conditions, and less to stems and leaves. Mina et al. ([54]) recently replaced AET/PET in FORCLIM with a function integrating monthly soil moisture status, with seasonally varying parameters calibrated against tree-ring width. This way, they were able to account for intra-annual drought effects with no increase in complexity, which improved predictions of basal area and stem numbers.
As radial growth is a reliable indicator of tree vitality ([22]), many models (e.g., FORCLIM) use an empirical function to link environmentally dependent mortality to simulated growth. In other models, mortality is simulated independently of growth. For example, FORECAST-Climate uses a nonlinear function of two-year AT/PT to calculate drought-related mortality. The model DSS-WuK ([82]) uses two different drought indices for growth and mortality: growth is linked to climatic water balance through statistical relationships, whereas mortality is parameterized as a function of drought duration (Fig. 4a). This index is calculated at the species level and expresses the number of days with soil water potential below a species-specific critical level. Therefore, drought-induced mortality only occurs under conditions that are relatively rare in the model’s intended region of application (Germany).
Gustafson & Sturtevant ([36]) used the PDSI to simulate drought-induced mortality in the forest landscape model LANDIS. In this rare example of using relative drought indices in a dynamic model, they fitted empirical relationships between drought characteristics and observed mortality. In their study area (Great Lakes region in the Northern USA), they found that drought length was a better predictor for mortality than drought severity. However, transferring this model to other regions proved challenging ([37]). Later versions of LANDIS use an explicit calculation of biomass growth and allocation ([37]).
The differential response of tree species to water shortage requires the attribution of a specific drought tolerance parameter to each species represented in a model. This parameter is usually set based on meta-analyses where species were ranked on a spectrum of drought tolerance ([27]), sometimes in combination with the modeler’s expert opinion, or on observed species distribution ([48]). A potential drawback of using a single parameter for drought sensitivity is that this approach does not differentiate between drought tolerance (the ability to survive in an environment with frequent water shortage) and drought sensitivity (the magnitude of the response to a drought event). Indeed, drought tolerant species growing on dry sites may be more sensitive to drought events than less tolerant species growing on a nearby wetter site (e.g., with a greater soil water holding capacity), as a (meteorological) drought event translates into more severe (physiological) drought at the drier site ([63]).
A related question pertains to the significance of species-specific drought tolerance parameters in mixed stands. In a dynamic model, drought tolerant species have a competitive advantage over less tolerant ones in dry environments. However, this involves various mechanisms, e.g., a better tolerance of physiological drought or a higher ability to mobilize water in a drying soil. Belowground interactions are complex and context-dependent, and considerable uncertainty remains regarding below ground interactions between plants ([63]). The inability to properly account for such effects is a drawback of many dynamic forest models. With indices that are closer to physiology, it is possible to circumvent these problems somewhat. For example, the model of Thiele et al. ([82]) requires a critical soil water potential value for each species. Unlike the drought tolerance parameters discussed above, this quantity has a clear physical meaning.
Current debates and open questions
The role of VPD for physiological drought
Various studies have highlighted the role of atmospheric drought in plant-water relations, beyond its effect of depleting soil moisture by increasing evaporative demand. Variations in vapor pressure deficit (VPD) account for a similar fraction of changes in stomatal conductance ([60]) as variations in soil moisture. At longer time scales, static models of species distribution have been improved by including mean VPD ([46]) as a covariate, along measures of soil moisture. Increasing VPD and decreasing soil moisture both have the effect of increasing the tension of water in the xylem ([85]). As discussed above, this puts the tree at a higher risk of loss of hydraulic conductance and runaway embolism. Trees can mitigate this risk through stomatal regulation, at the risk of not taking up enough carbon or water to sustain vital functions. Soil moisture and VPD are correlated at seasonal time scales, but largely independent at hourly to daily time scales, as VPD varies much faster than soil moisture ([60]).
Reduced soil water availability leads to so-called “static stress”, with low water potentials throughout the tree ([85]). By contrast, “dynamic stress” (not to be confused with the dynamic water stress of [65]) involves rapid movement of water through the tree, and greatly increases the risk of cavitation ([85]). Typically, static stress is more important during extended soil drought or in more arid environments, whereas dynamic stress has a greater role when soil moisture is not limiting and atmospheric evaporative demand is high ([85], [101]).
The water balance models used to calculate AET/PET or AT/PT differ in their representation of stomatal regulation. Physically-based models, such as BROOK90 ([38]), include an explicit representation of soil hydraulics, and account for resistances in the rhizosphere and within the plant during periods of high transpiration. Thus, transpiration may be reduced below its potential rate even if the bulk soil water content is above critical levels ([74]). Other water balance models use an empirical formulation of stomatal behavior, where actual transpiration is defined as a function of PT and soil water content only. The resulting drought index can be expected to behave very similarly to soil moisture-based indices. To account for the effects of high VPD, some of these models define an additional growth modifier ([45], [77]) or use a composite drought index combining the effects of low soil moisture and high VPD ([99]). Like other versions of AET/PET or AT/PT, these indices define physiological drought as periods where stomata close due to low water availability (or high demand). Also here, stomatal closure does not necessarily represent a cause of physiological damage (e.g., through reduced carbon uptake), but as a symptom occurring at all stages of physiological drought, and thus as a reliable indicator of water shortage ([65]). It is not clear whether the effects of high VPD and low soil moisture are best modeled as interactive (both effects are combined by e.g., multiplying the two modifiers, as in [99]) or mutually exclusive (only the more severe of the two modifiers is used, as in [45] and [77]). In the only direct comparison known to the author, Wei et al. ([95]) used both versions in 3-PG to predict stable carbon isotope ratios in plant tissue, and obtained better results with the interactive process formulation.
Suitability of drought indices under climate change
One of the main uses of drought indices is to assess temporal trends in drought frequency and intensity, and to estimate their future evolution under predicted climate change. This was the main reason to develop the SPEI, as variations in precipitation alone do not capture the effect of higher temperatures and the associated increase in evaporative demand ([87]). While the inclusion of evaporative demand is critical to assess drought under climate change, the way in which it is included can have great implications for the resulting drought index values. For example, various procedures to estimate potential evaporation (PE) have been used, with important conceptual differences. Some of these formulations, e.g., the widely-used function of Thornthwaite ([83]), rely only on empirical relationships between temperature and evaporative demand at a given latitude. On the other hand, the Penman and Penman-Monteith equations ([56]) are simplified but robust models of the underlying physical processes and account for the effect of net radiation, relative humidity and wind speed in addition to temperature. It has been demonstrated ([78]) that empirical PE formulations are excessively sensitive to changes in temperature compared to more physically-based methods, raising concerns regarding their applicability under climate change. Global-scale comparisons of scPDSI and SPEI values obtained with Thornthwaite and Penman-Monteith formulations revealed that despite great differences in PE, both formulations indicated similar trends in most regions of the world ([86], [14]). Cavin et al. ([14]) even found a slightly stronger drying trend over the period 1966-2006 when using SPEI with Penman-Monteith instead of Thornthwaite. Indeed, PDSI and its variants are much more sensitive to changes in precipitation than to changes in PE ([86]). The choice of PE method is probably more critical for other indices, such as site water balance and AET/ PET, where the absolute values of PE have a greater effect on the index value than for PDSI and SPEI. As the Penman-Monteith formula requires more meteorological inputs, it is also subject to other sources of uncertainty. For example, changes in solar radiation and wind speed can also affect trends of PDSI ([97]). Also, higher CO2 concentrations may affect stomatal conductance, which affects reference evaporation, leading to less severe drought estimates, all other factors kept equal ([53]).
Synthesis and conclusions
The aims of this review are twofold: first, to clarify the rationale behind various drought and aridity indices, and second, to assess the suitability of these indices for quantifying water availability in physiological and bioclimatological analysis, as well as in dynamic forest models. The indices reviewed here consider various degrees of information. Some indices only use information on the temporal distribution, anomalies and absolute values of precipitation, while others take into account evaporative demand. These two groups of indices are thus based on atmospheric conditions only, and do not take into account land surface processes. From a long-term perspective, water supply and demand have long been recognized as two crucial factors shaping the spatial distribution of biomes and species. When inter-annual variations are of interest, it is reasonable to expect that departures from the long-term conditions will have an impact on plant physiology. Analyzing temporal trends of these indices can give information on how the abiotic conditions at a certain location change, and to isolate this abiotic forcing from ecosystem response. Another type of indices take into account soil moisture dynamics. These indices are typically calculated on soil moisture simulated by a dynamic model. A similar approach is to use the ratio or difference of actual and potential evaporation or transpiration. The assumption behind this approach is that stomatal regulation, a process simulated in many water balance models, is an indicator of periods in which water supply affects plant physiology. Therefore, stomatal closure is not necessarily seen as a cause of adverse conditions, but as a readily available indicator of physiological drought. Finally, some indices directly account for physiological thresholds. Although these indices can be expected to be well-suited to quantify physiological drought, they are still simplifications that reduce a complex phenomenon into a single scalar, and are therefore also associated with a considerable loss of information.
Many indices can be calculated in many different ways, which affects their properties. For example, the temporal scale or integration period must be chosen a priori. As different ecosystems react to droughts at different timescales, this choice is crucial for the analysis of drought effects. Moreover, different assumptions on the effect of temperature on evaporative demand can greatly impact projections of future water availability under a changing climate. For indices based on water balance, the choice of model can have a great impact on the ecological significance of the calculated indices. For example, some models do not account for variations in vegetation properties in their calculation of canopy evaporative demand, so that the resulting indices are indicative of abiotic site conditions. On the other hand, with models that take into account vegetation and site properties, the resulting indices reflect the conditions experienced by the actual vegetation, with e.g., lower levels of physiological drought for less dense vegetation, all other factors being equal. Another distinction is how the models simulate the transfer of water along the soil-plant-atmosphere continuum. Indeed, models that explicitly simulate the movement of water in soil, as well as plant-internal resistances, account for the physiological effects of high atmospheric water demand. On the other hand, models that only include the effect of soil moisture through stomatal regulation do not include these processes. Reducing stomatal conductance as a function of VPD in addition to soil moisture might improve the representation of physiological drought with such models.
The relatively small number of studies that have evaluated various drought indices against physiological indicators, as well as the sometimes diverging results, make it difficult to derive general conclusions regarding the suitability of drought indices for analyses and modeling. A few general patterns emerge from this review. In a majority of studies, indices that combine precipitation and evaporative demand showed a closer relationship to drought indicators than indices based on precipitation alone. Including soil moisture storage was especially beneficial when sites with differences in soil water holding capacity were compared. Several studies also reported a differential sensitivity of tree species to different indices. However, given the small number of comparative studies, it is not possible to determine whether this is due to differing properties of the indices. This suggests that further evaluations and intercomparisons of drought indices are necessary, and should include several climates and species. As discussed in the previous paragraph, there are many ways to calculate the same index, i.e., using different integration periods, threshold and parameter values, and underlying models. Reporting these methodological details and discussing their physiological or ecological implications might give some valuable context. It is worth noting that several of the intercomparisons reviewed here were published as reports or in non-English language journals. While this highlights the importance of this topic for practitioners, publishing such results in international journals would provide useful guidance to the scientific community for choosing appropriate indices for biometeorological and physiological analysis, as well as model development.
Acknowledgments
This research was funded by the Swiss National Science Foundation (no. 153544) and the Swiss Federal Office for the Environment (no. 15.0003.PJ/Q104-0149). Meteorological data was provided by the Swiss Federal Office of Meteorology and Climatology (MeteoSwiss). The author would like to thank Heike Lischke, Massimiliano Zappa, Giorgio Vacchiano and Richard Peters, as well as the three anonymous reviewers, for their feedback, which helped improve this manuscript.
References
CrossRef | Gscholar
Gscholar
CrossRef | Gscholar
CrossRef | Gscholar
Gscholar
Gscholar
Gscholar
Gscholar
CrossRef | Gscholar
CrossRef | Gscholar
Gscholar
Gscholar
Gscholar
Gscholar
Gscholar
Gscholar
Gscholar
Authors’ Info
Authors’ Affiliation
Swiss Federal Research Institute WSL, 8903 Birmensdorf (Switzerland)
Corresponding author
Paper Info
Citation
Speich MJR (2019). Quantifying and modeling water availability in temperate forests: a review of drought and aridity indices. iForest 12: 1-16. - doi: 10.3832/ifor2934-011
Academic Editor
Carlotta Ferrara
Paper history
Received: Jul 28, 2018
Accepted: Nov 13, 2018
First online: Jan 10, 2019
Publication Date: Feb 28, 2019
Publication Time: 1.93 months
Copyright Information
© SISEF - The Italian Society of Silviculture and Forest Ecology 2019
Open Access
This article is distributed under the terms of the Creative Commons Attribution-Non Commercial 4.0 International (https://creativecommons.org/licenses/by-nc/4.0/), which permits unrestricted use, distribution, and reproduction in any medium, provided you give appropriate credit to the original author(s) and the source, provide a link to the Creative Commons license, and indicate if changes were made.

Web Metrics
Breakdown by View Type
Article Usage
Total Article Views: 38704
(from publication date up to now)
Breakdown by View Type
HTML Page Views: 30487
Abstract Page Views: 3456
PDF Downloads: 4228
Citation/Reference Downloads: 25
XML Downloads: 508
Web Metrics
Days since publication: 1925
Overall contacts: 38704
Avg. contacts per week: 140.74
Article Citations
Article citations are based on data periodically collected from the Clarivate Web of Science web site
(last update: Feb 2023)
Total number of cites (since 2019): 10
Average cites per year: 2.00
Publication Metrics
by Dimensions ©
Articles citing this article
List of the papers citing this article based on CrossRef Cited-by.
Related Contents
iForest Similar Articles
Research Articles
The impact of land use on future water balance - A simple approach for analysing climate change effects
vol. 14, pp. 175-185 (online: 13 April 2021)
Research Articles
Factors of soil CO2 emission in boreal forests: evidence from Central Siberia
vol. 16, pp. 86-94 (online: 19 March 2023)
Research Articles
Seeing, believing, acting: climate change attitudes and adaptation of Hungarian forest managers
vol. 15, pp. 509-518 (online: 14 December 2022)
Research Articles
Potential impacts of regional climate change on site productivity of Larix olgensis plantations in northeast China
vol. 8, pp. 642-651 (online: 02 March 2015)
Research Articles
Model-based assessment of ecological adaptations of three forest tree species growing in Italy and impact on carbon and water balance at national scale under current and future climate scenarios
vol. 5, pp. 235-246 (online: 24 October 2012)
Research Articles
Predicting the effect of climate change on tree species abundance and distribution at a regional scale
vol. 1, pp. 132-139 (online: 27 August 2008)
Research Articles
Soil water deficit as a tool to measure water stress and inform silvicultural management in the Cape Forest Regions, South Africa
vol. 13, pp. 473-481 (online: 01 November 2020)
Research Articles
Evaluation of fast growing tree water use under different soil moisture regimes using wick lysimeters
vol. 6, pp. 190-200 (online: 08 May 2013)
Research Articles
Impact of climate change on radial growth of Siberian spruce and Scots pine in North-western Russia
vol. 1, pp. 13-21 (online: 28 February 2008)
Research Articles
Role of forest cover, land use change and climate change on water resources in Marmara basin of Turkey
vol. 8, pp. 480-486 (online: 31 October 2014)
iForest Database Search
Search By Author
Search By Keyword
Google Scholar Search
Citing Articles
Search By Author
Search By Keywords
PubMed Search
Search By Author
Search By Keyword